


2022 Eastern Pacific Hurricane Season
2011 | 2012 | 2013 | 2014 | 2015 | 2016 | 2017 | 2018 | 2019 | 2020 | 2021 | 2022 | 2023
The National Hurricane Center and Central Pacific Hurricane Center's Tropical Cyclone Reports (TCRs) contain information on all tropical (and subtropical) cyclones that have occurred within the Atlantic, eastern Pacific, and central Pacific basins, including synoptic history, meteorological statistics, casualties and damages, and the post-analysis best track (six-hourly positions and intensities). Beginning in 2023, comprehensive versions of these reports will continue to be provided for all tropical cyclones in which coastal watches and warnings were in effect or direct fatalities were reported, and for other select storms with significant public or research interest (e.g., storms investigated via research field campaigns). Otherwise, abbreviated TCRs will be produced that include a short description of the cyclone’s origin, justification of the analyzed maximum winds and minimum pressure, noteworthy statistics, and the post-analysis best track. The abbreviated TCRs also contain the full suite of tables and figures that are included in the comprehensive reports. Tropical cyclones include depressions, storms and hurricanes. Tropical depressions included below are those that did not reach tropical storm strength. Potential tropical cyclones listed below are disturbances that NHC issued advisories on based on their threat to land, but which failed to develop into tropical cyclones.
XML index of all Tropical Cyclone Reports
Atlantic | Eastern Pacific | Central Pacific
- Hurricane Agatha – PDF – KMZ – SHP
- Hurricane Blas – PDF – KMZ – SHP
- Tropical Storm Celia – PDF – KMZ – SHP
- Hurricane Bonnie – PDF – KMZ – SHP
- Hurricane Darby – PDF – KMZ – SHP
- Hurricane Estelle – PDF – KMZ – SHP
- Hurricane Frank – PDF – KMZ – SHP
- Tropical Storm Georgette – PDF – KMZ – SHP
- Hurricane Howard – PDF – KMZ – SHP
- Tropical Storm Ivette – PDF – KMZ – SHP
- Tropical Storm Javier – PDF – KMZ – SHP
- Hurricane Kay – PDF – KMZ – SHP
- Tropical Storm Lester – PDF – KMZ – SHP
- Tropical Storm Madeline – PDF – KMZ – SHP
- Tropical Storm Newton – PDF – KMZ – SHP
- Hurricane Orlene – PDF – KMZ – SHP
- Tropical Storm Paine – PDF – KMZ – SHP
- Hurricane Julia1 – PDF – KMZ – SHP
- Hurricane Roslyn – PDF – KMZ – SHP
- Julia updated 15 Mar 2023
Eastern North Pacific Tropical Cyclone Tracks
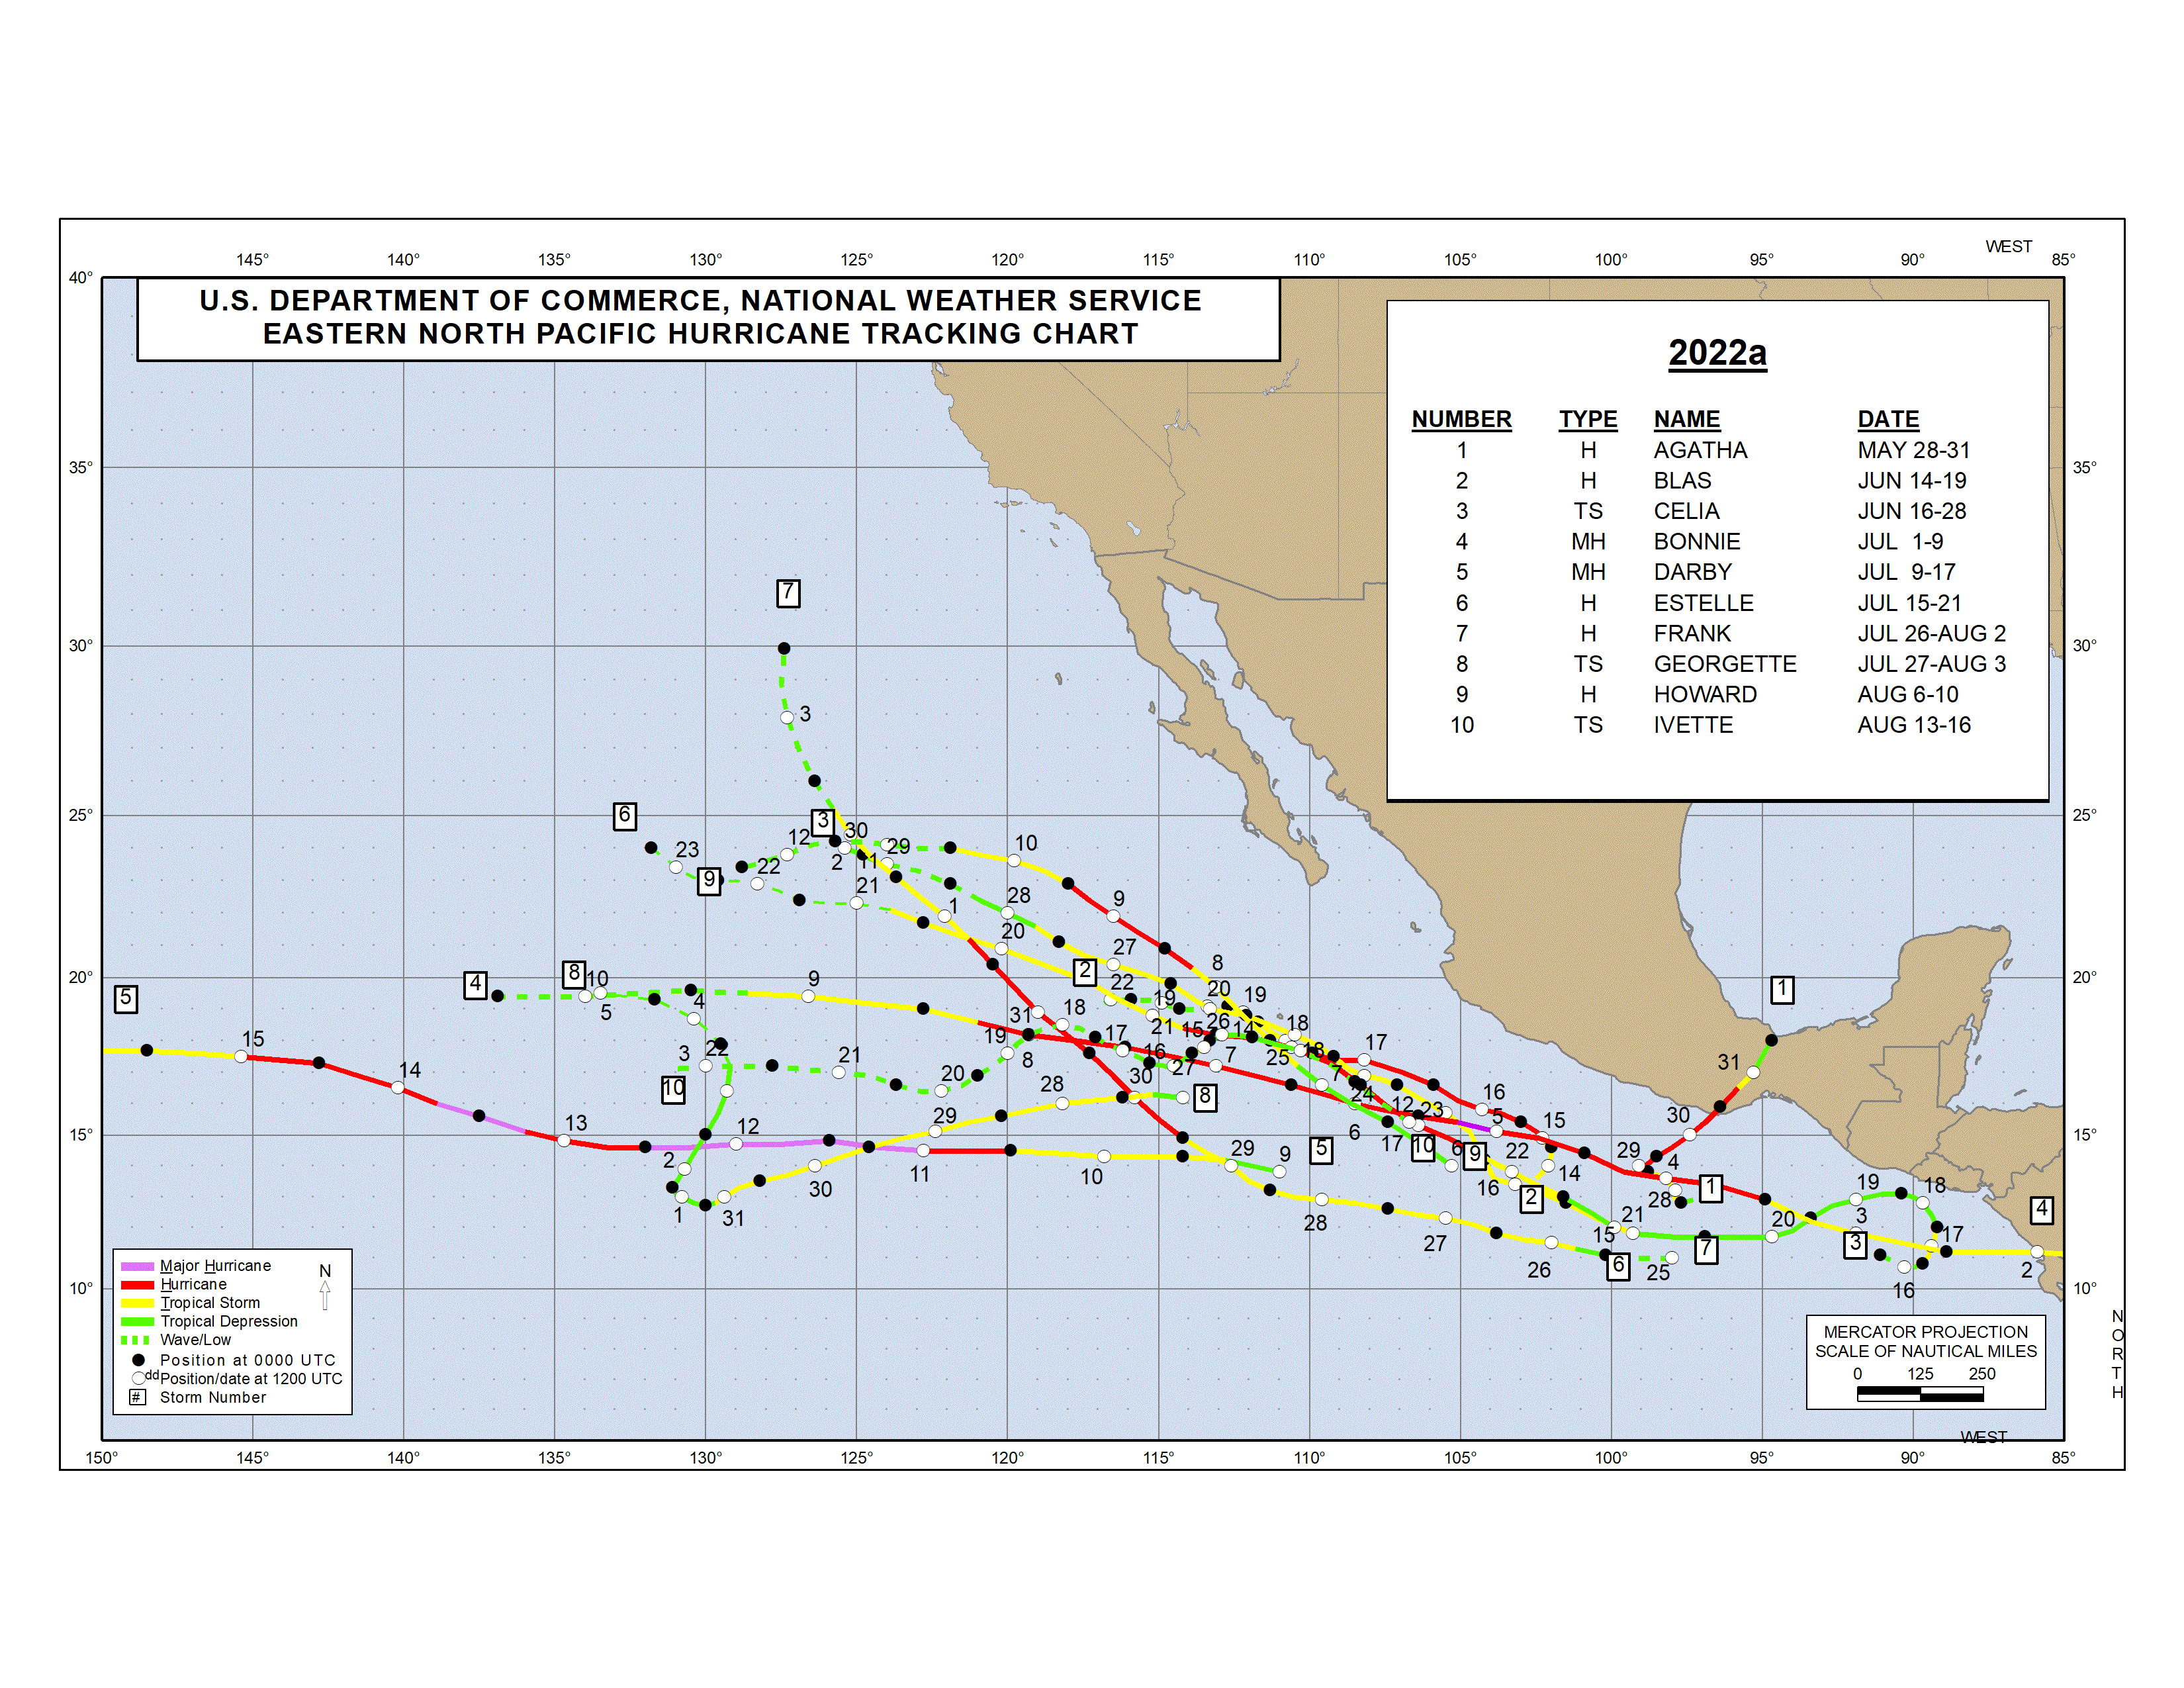
2022 Eastern North Pacific Hurricane Season Track Map Part a (click to enlarge)
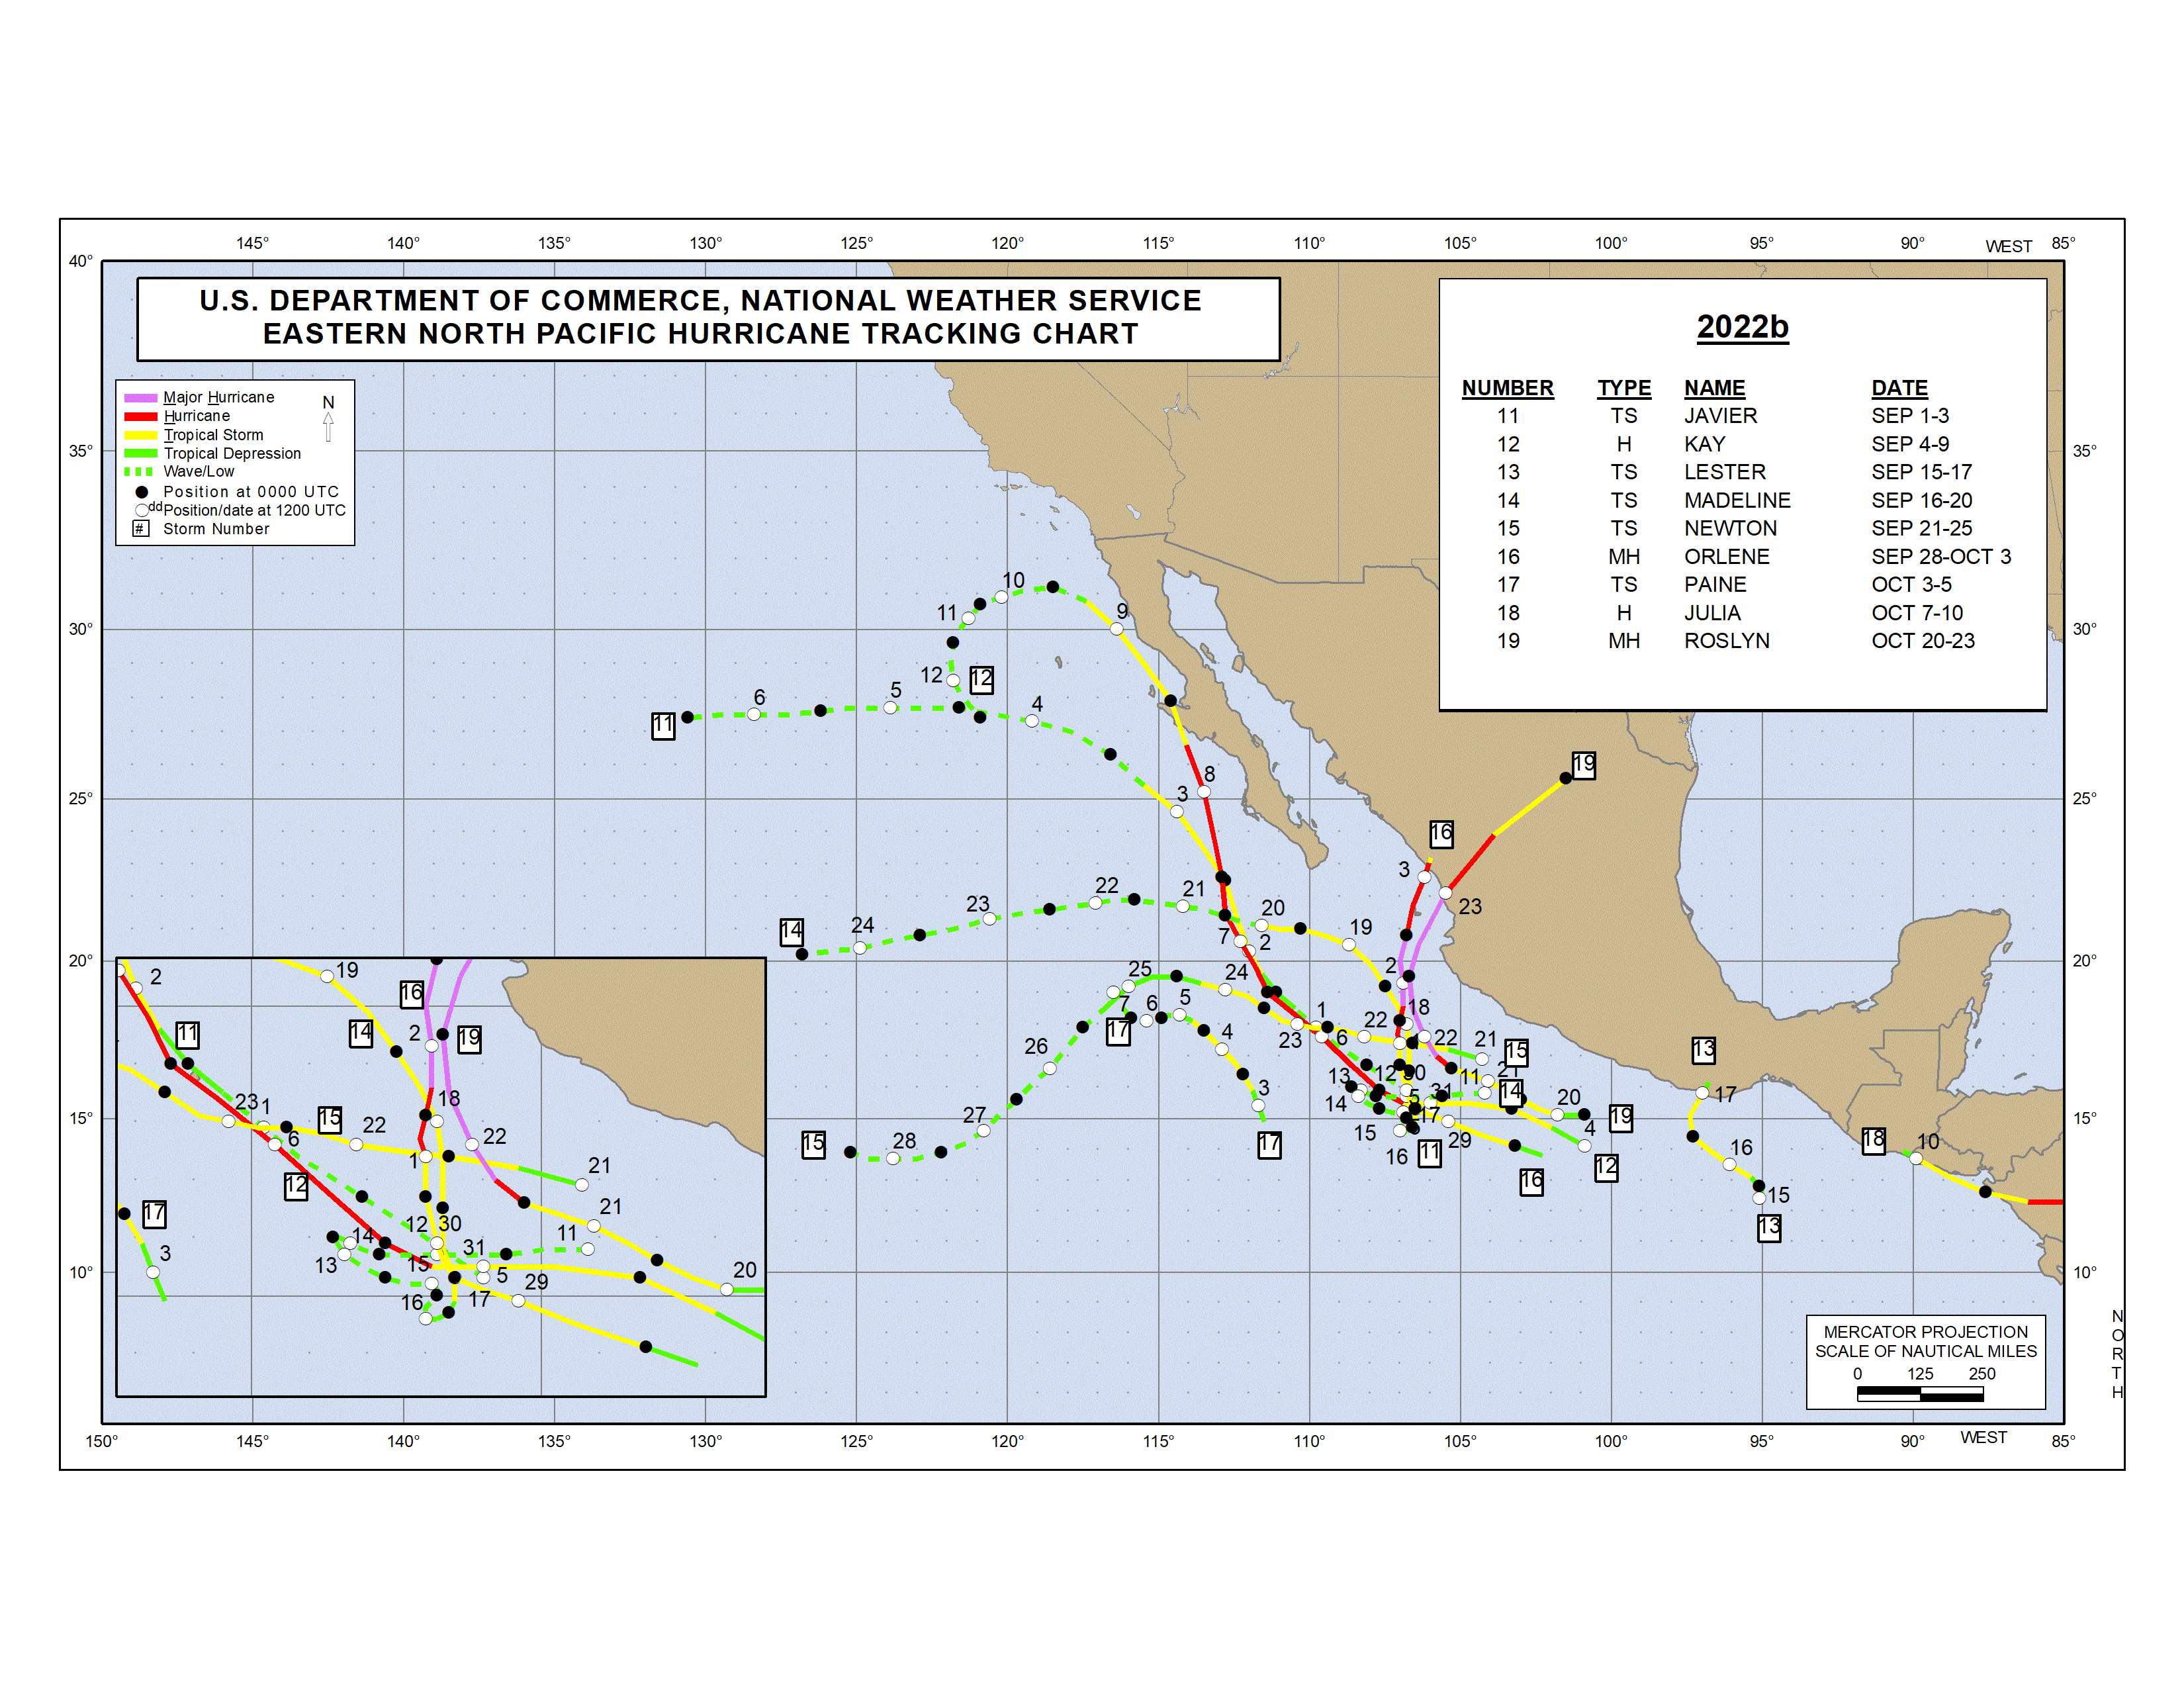
2022 Eastern North Pacific Hurricane Season Track Map Part b (click to enlarge)
If you have trouble viewing linked files, obtain a free viewer for the file format: