Skip Navigation Links
NOAA NOAA United States Department of Commerce

NHC Graphical Outlook Archive


« Earliest Available         ‹ Earlier         Later ›         Latest Available »
GIS Shapefiles
Central Pacific Eastern Pacific Atlantic

View 2-Day Graphical Tropical Weather Outlook
Click for Eastern North Pacific Click for Eastern North Pacific

Tropical Weather Outlook Text

ZCZC HFOTWOCP ALL
TTAA00 PHFO DDHHMM

Tropical Weather Outlook
NWS Central Pacific Hurricane Center Honolulu HI
200 AM HST Mon Aug 12 2019

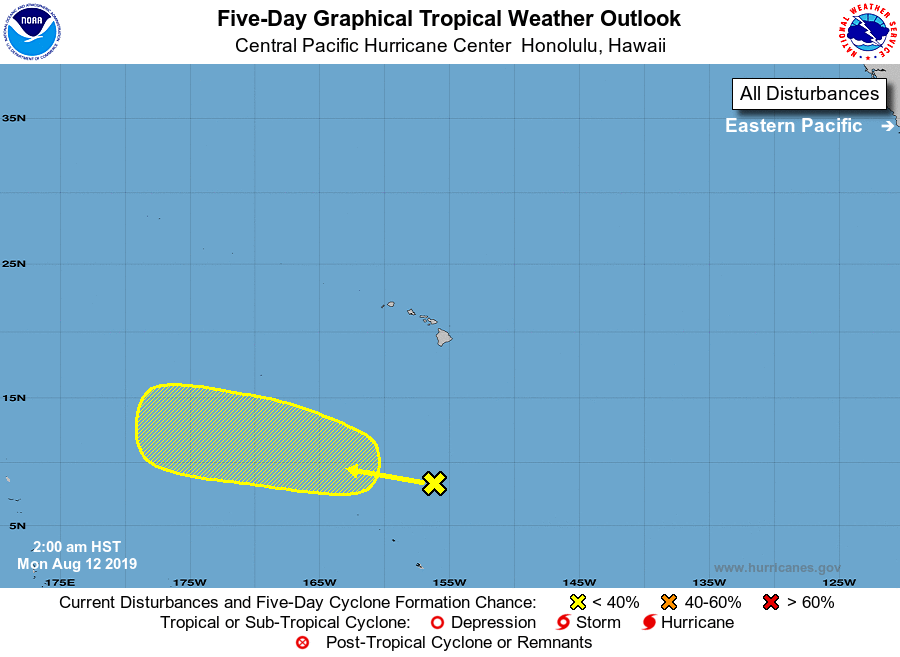
For the central North Pacific...between 140W and 180W:

1. A disorganized area of showers and thunderstorms located several
hundred miles south of the Big Island is associated with a trough of
low pressure. IR satellite imagery shows good outflow with existing
convection in the area. Environmental conditions are expected to
become more conducive for slow development of the system through the
week as it moves west to west-northwest at 10 to 15 mph.
* Formation chance through 48 hours...low...near 0 percent.
* Formation chance through 5 days...low...30 percent.

Elsewhere, no tropical cyclones are expected during the next 5 days.

Forecaster TS


List of Atlantic Outlooks (May 2023 - present)
List of East Pacific Outlooks (May 2023 - present)
List of Central Pacific Outlooks (May 2023 - present)
List of Atlantic Outlooks (July 2014 - April 2023)
List of East Pacific Outlooks (July 2014 - April 2023)
List of Central Pacific Outlooks (June 2019 - April 2023)
List of Atlantic Outlooks (June 2009 - June 2014)
List of East Pacific Outlooks (June 2009 - June 2014)