Storm Surge Products
Storm Surge Watch and Warning Graphic
Product Description: Storm surge is rising water moving inland from the shoreline, pushed by the force of the wind. The Storm Surge Watch and Warning Graphic displays areas under a storm surge watch or warning. A storm surge warning means that there is a danger of life-threatening inundation from rising water moving inland from the shoreline somewhere within the specified area, generally within 36 hours. A storm surge watch means that life-threatening inundation is possible somewhere within the specified area, generally within 48 hours.
The graphic is intended to help users visualize areas most at risk from life-threatening surge, and serve as a call to action. All persons, regardless of whether or not they are in the highlighted areas shown by the graphic, should promptly follow evacuation orders and other instructions from local emergency management officials. The graphic is the result of a collaborative process between the National Hurricane Center and local Weather Forecast Offices.
Availability: This graphic is part of a suite of products issued for active tropical cyclones every six hours at 0300, 0900, 1500, and 2100 UTC whenever storm surge watches or warnings are in effect along any portion of the United States Gulf or Atlantic coasts, Puerto Rico, the U.S. Virgin Islands, or the main Hawaiian Islands. The graphic can be updated with any changes in the intermediate advisory package or with a special advisory. When active, the Storm Surge Watch and Warning Graphic will be available on the NHC website in a web map viewer.

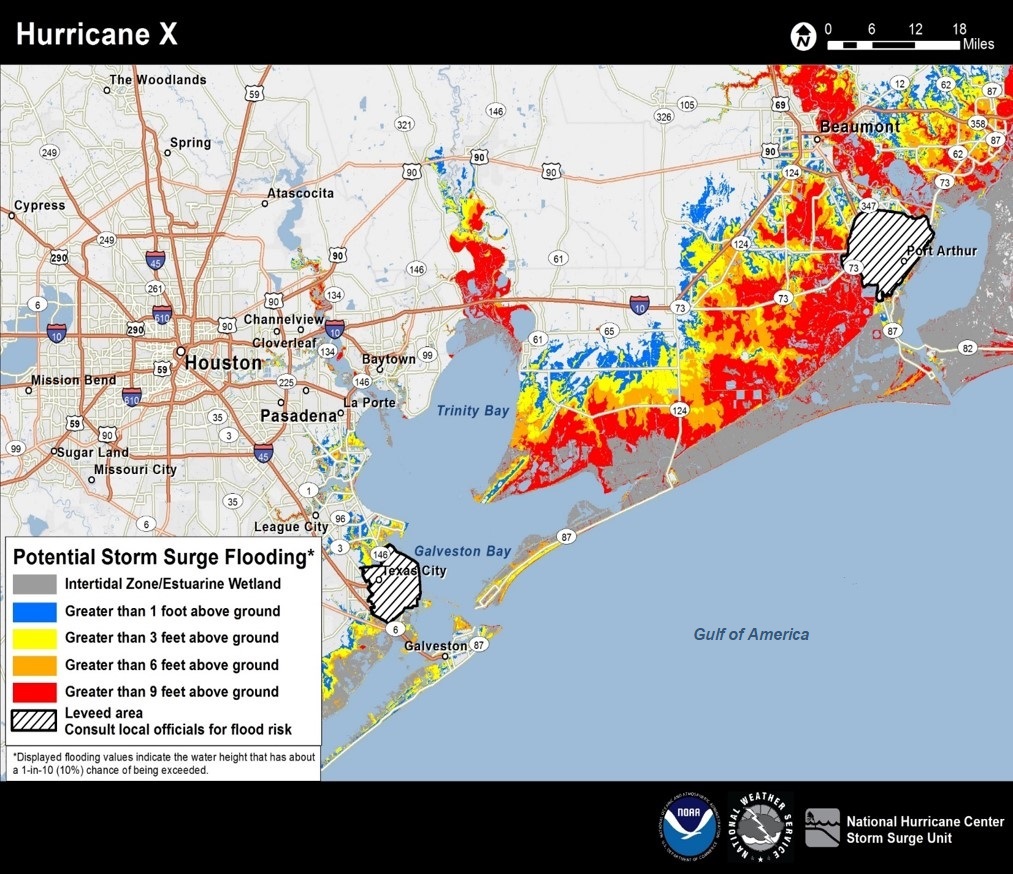
Potential Storm Surge Flooding Map
Product Description: The Potential Storm Surge Flooding Map shows geographical areas where inundation from storm surge could occur and how high above ground the water could reach in those areas. The map is based on the Probabilistic Tropical Cyclone Storm Surge and Tides (P-surge) model that uses the latest NHC official forecast and historical forecast errors to create an ensemble of simulations that accounts for uncertainty related to the storm's landfall location and forward speed, intensity, and size. The shading on the Potential Storm Surge flooding map represents inundation levels that have a 10 percent chance of being exceeded, which can, therefore, be thought of as representing a reasonable worst-case scenario for any individual location. The map is subject to change every six hours in association with a new NHC full advisory package.
Availability: This graphic is part of a suite of products issued for active tropical cyclones every six hours at 0300, 0900, 1500, and 2100 UTC whenever storm surge watches or warnings are in effect along any portion of the United States Gulf or Atlantic coasts, Puerto Rico, the U.S. Virgin Islands, or the main Hawaiian Islands. The graphic can be issued at other times as appropriate, including for hurricane or tropical storm wind watches or warnings. The first map will usually be issued along with the first issuance of the storm surge watch, approximately 48 hours prior to hazardous weather conditions, but, in some cases, it can be issued as early as 72 hours in advance when confidence in the forecast and storm surge guidance is high. When active, the Potential Storm Surge Flooding Map will be available on the NHC website in a web map viewer, for GeoTIFF data download for viewing in local GIS, and as a map service on NOAA nowCOAST OGC Map Services (WMS). Due to the processing time required to produce the map, there will generally be a delay of an hour or more in the posting of this graphic to the NHC website or soon after the availability of the P-Surge products.
An interactive example of the Potential Storm Surge Flooding map can be found here.
Peak Storm Surge Forecast Graphic
Product Description: The Peak Storm Surge Forecast Graphic shows the expected inundation along the immediate coast from storm surge and tides that are provided in the tropical cyclone public advisory (TCP). These values represent the height that water could reach above normally dry ground somewhere within the specified areas. A range of values is given to express forecast uncertainty and to account for varying coastal geography. Colors are based on the highest value in the associated forecast range, thus different forecast ranges can appear as the same color (e.g. 3-5 ft, 3-6 ft, and 2-4 ft all appear yellow in the example graphic because the highest value in the range is "Up to 6 ft"). The graphic is subject to change every three hours in association with a new NHC full or intermediate advisory package.
Availability: This graphic is part of a suite of products issued for active tropical cyclones every six hours at 0300, 0900, 1500, and 2100 UTC whenever storm surge watches or warnings are in effect along any portion of the United States Gulf or Atlantic coasts, Puerto Rico, the U.S. Virgin Islands, or the main Hawaiian Islands. The graphic can be issued at other times as appropriate, including for hurricane or tropical storm wind watches or warnings. The Peak Storm Surge Forecast is generally provided within 48 hours of storm surge occurring in a given area. The graphic can be updated with changes in the intermediate advisory or with a special advisory. When active, the Peak Storm Surge Forecast Graphic will be available on the NHC website and for KML data download.
