Potential Storm Surge Flooding Map
Contents
1. Overview
This information is also available in an NWS Product Description Document (PDF format).
Storm surge is often the greatest threat to life and property and directly accounts for about half of the deaths associated with tropical cyclones in the United States (Rappaport, 2014). In an effort to improve overall awareness and understanding of the storm surge flooding threat, the National Hurricane Center (NHC) will be issuing a Potential Storm Surge Flooding Map effective 2016 for certain tropical cyclones that affect the East and Gulf Coasts of the United States.
2. Product Description
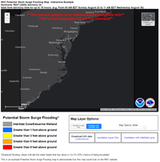
The Potential Storm Surge Flooding Map is a new operational product that depicts the risk associated with coastal flooding from storm surge associated with tropical cyclones. Developed over the course of several years in consultation with social scientists, emergency managers, broadcast meteorologists, and others, this map shows:
- Geographical areas where inundation from storm surge could occur
- The heights, above ground, that water could reach in those areas
The geographic areas of possible storm surge flooding and the potential height of water above ground for a given storm are represented by different colors on the map based on water level:

What the Map Takes into Account
The Potential Storm Surge Flooding Map is based on the NWS Sea, Lake, and Overland Surges from Hurricanes (SLOSH) model and takes into account forecast uncertainty in the tropical cyclone track, intensity, and wind field. The map is based on probabilistic storm surge guidance developed by the NWS Meteorological Development Laboratory (MDL), in cooperation with NHC, called Probabilistic Hurricane Storm Surge (P-Surge 2.5).
P-Surge 2.5 derives storm surge probabilities by statistically evaluating a large set of SLOSH model simulations based on the current NHC official forecast, and takes into account historical errors in the official NHC track and intensity forecasts. P-Surge 2.5 combines the results of hundreds of individual SLOSH simulations to calculate the statistical distribution, or probabilities of possible storm surge heights at locations along the coast. All major factors that influence the amount of storm surge generated by a storm at a given location are accounted for, including the hurricane's landfall location, forward speed, and angle of approach to the coast; the storm intensity and wind field; the shape of the coastline; the slope of the ocean bottom; and local features such as barrier islands, bays, and rivers. The Potential Storm Surge Flooding Map is created by processing the resulting 10 percent exceedance levels from P-Surge 2.5, or storm surge values that have a 1-in-10 chance of being exceeded at each location.
The Potential Storm Surge Flooding Map takes into account:
- Flooding due to storm surge from the ocean, including adjoining tidal rivers, sounds, and bays
- Normal astronomical tides
- Land elevation
- Uncertainties in the landfall location, forward speed, angle of approach to the coast, intensity, and wind field of the cyclone
The Potential Storm Surge Flooding Map does not take into account:
- Wave action
- Freshwater flooding from rainfall
- Riverine discharge
- Flooding resulting from levee failures
- For mapped leveed areas – flooding inside levees, overtopping of levees
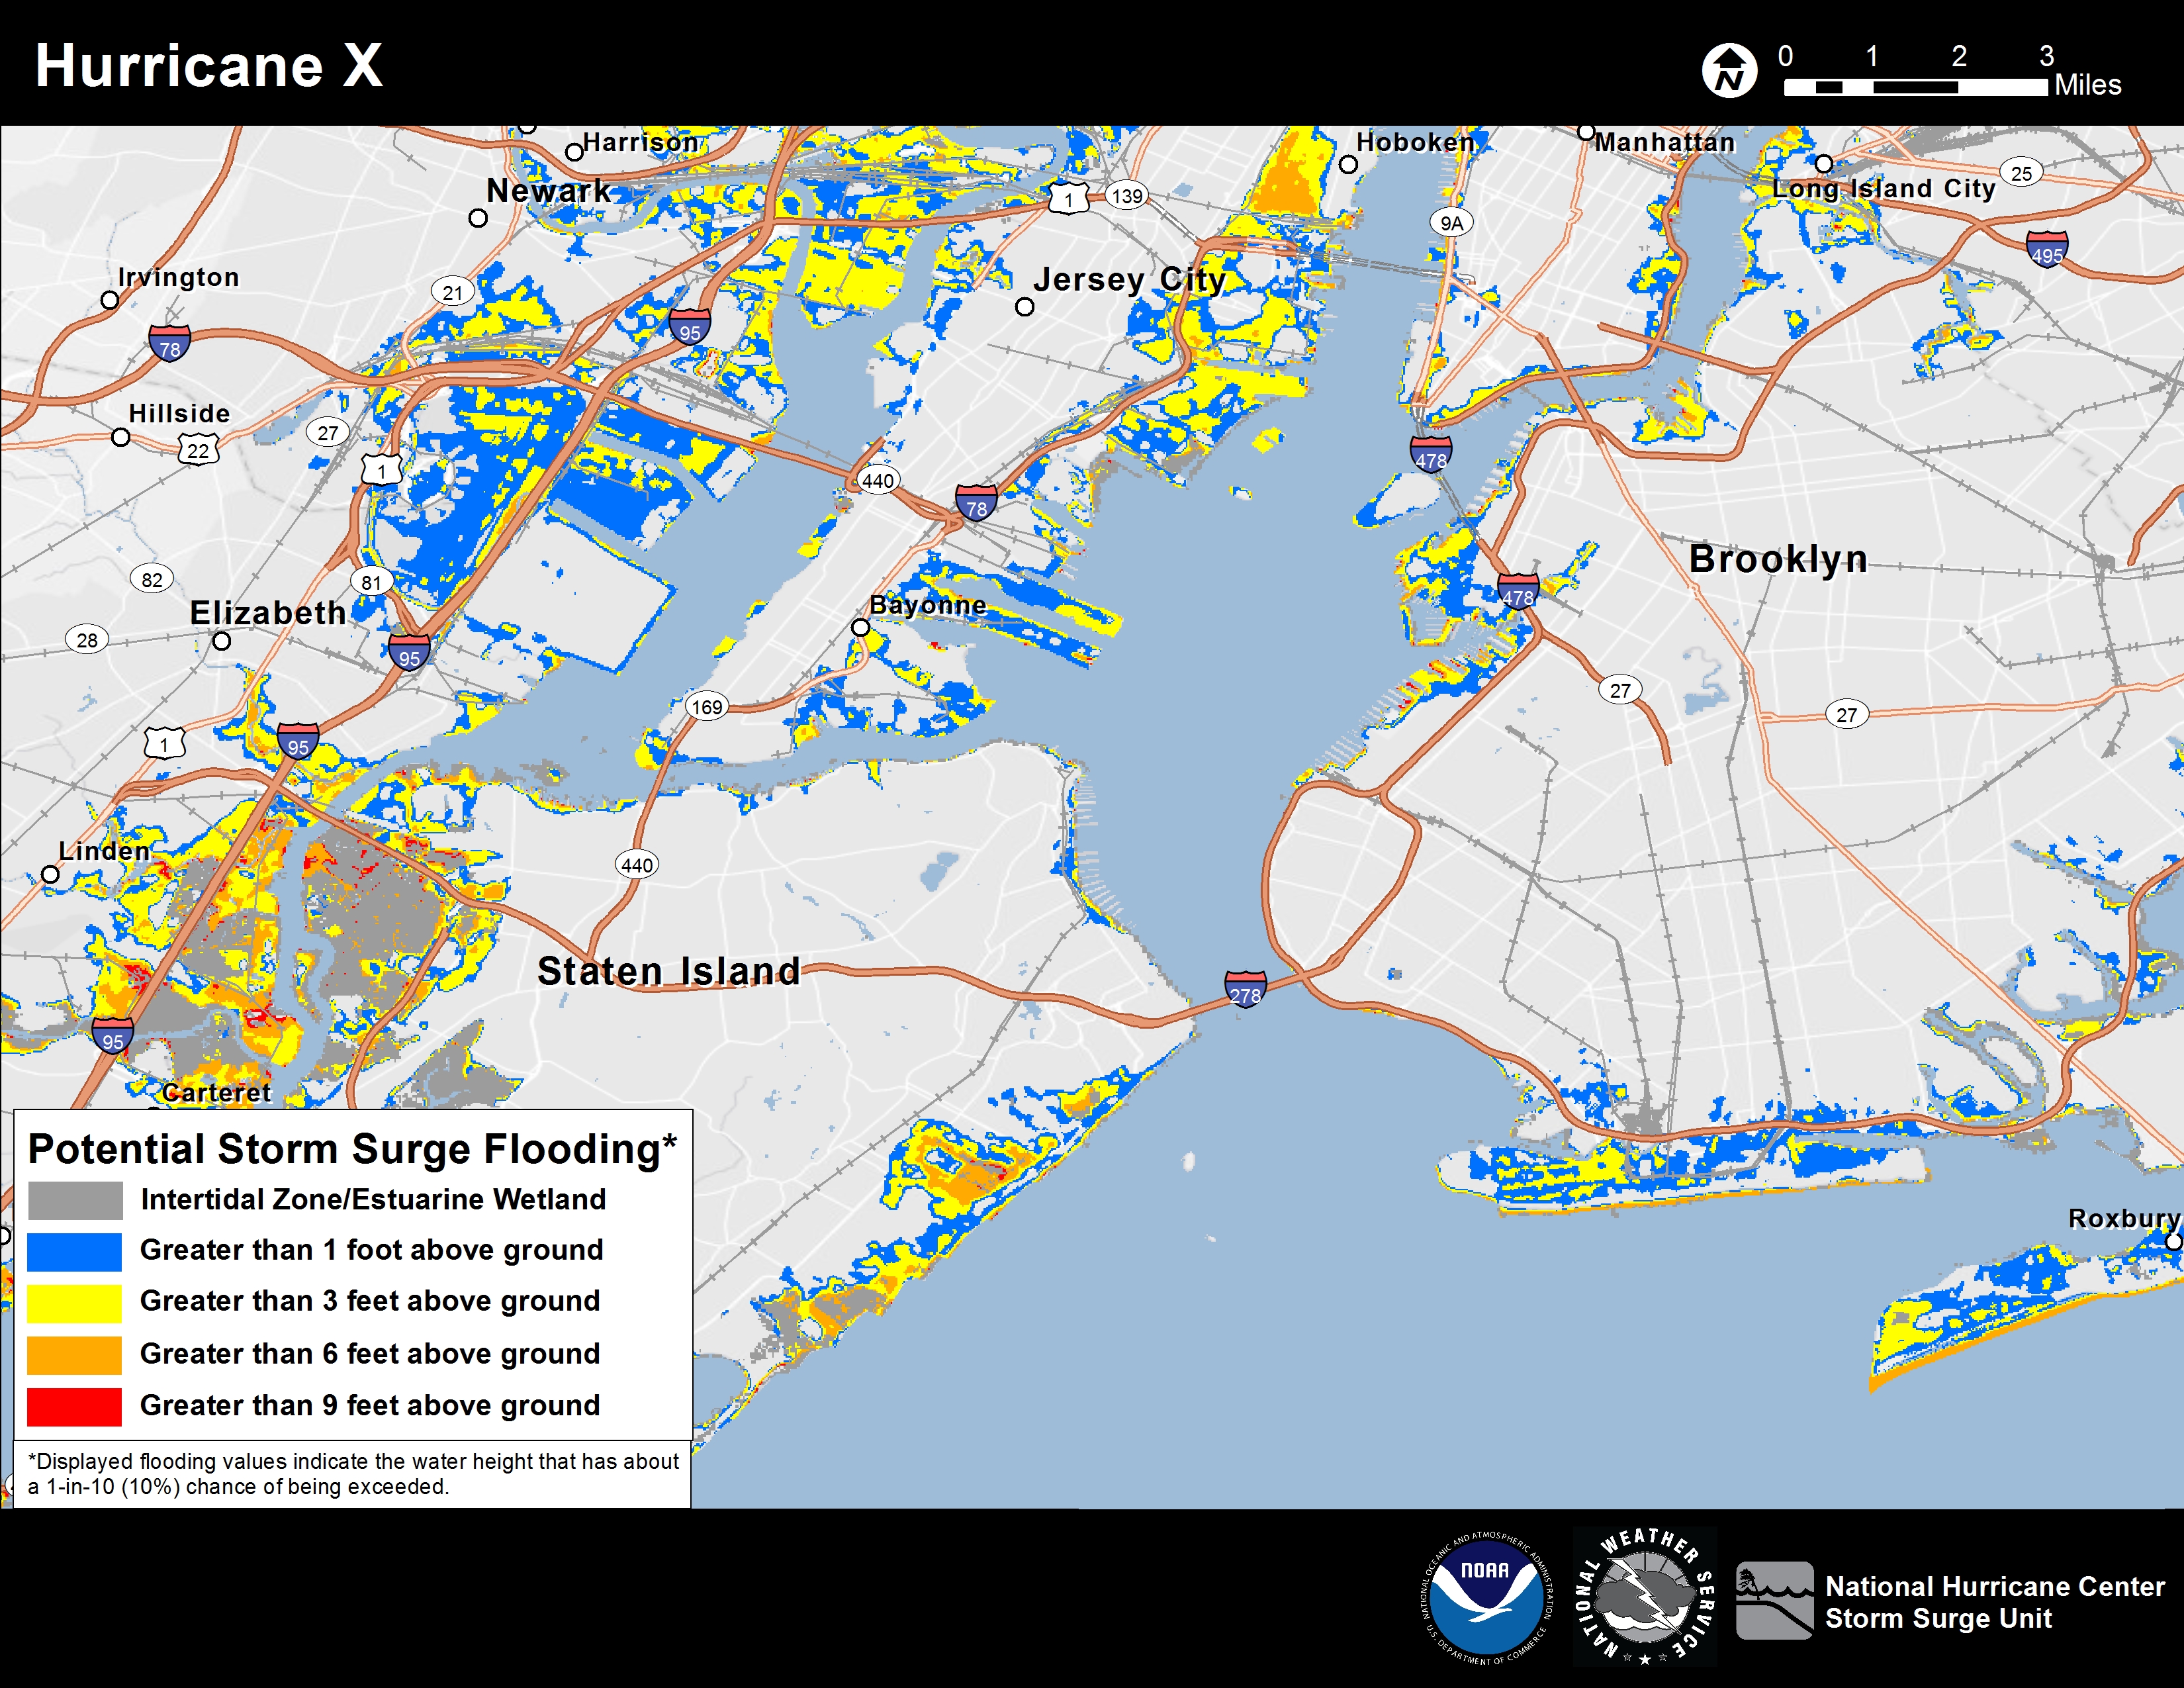
Potential storm surge flooding is not depicted within certain levee areas, such as the Hurricane & Storm Damage Risk Reduction System in Louisiana. These areas are highly complex and water levels resulting from overtopping are difficult to predict. Users are urged to consult local officials for flood risk inside these leveed areas. If applicable to the region displayed by the map, these leveed areas will be depicted with a black and white diagonal hatch pattern.

The intertidal zone, or generally speaking, the area that is above water at low tide and under water at high tide, will be displayed with a user selectable mask layer on the Potential Storm Surge Flooding Map. Locations of estuarine wetlands, or lands that are saturated with water, either permanently or seasonally, are also used to help define this mask layer. This mask layer will allow users to differentiate between areas that could experience consequential flooding of normally dry ground and areas that routinely flood during typical high tides. The intertidal mask will be depicted as gray on the Potential Storm Surge Flooding Map.

What the Map Represents
The Potential Storm Surge Flooding Map represents the storm surge heights that a person should prepare for before a storm, given the uncertainties in the meteorological forecast. The map shows a reasonable worst–case scenario (i.e., a reasonable upper bound) of the flooding of normally dry land at particular locations due to storm surge. There is approximately a 1-in-10 chance that storm surge flooding at any particular location could be higher than the values shown on the map. Roadways are included in the basemap layer for aiding in geographical referencing only. The map will not indicate which roadways may flood from fresh or salt water in a hurricane situation.
3. Methodology
How is the Potential Storm Surge Flooding map created?
NHC processes the 10 percent exceedance values from P-Surge using GIS to create the Potential Storm Surge Flooding Map. To calculate inundation, high-resolution elevation data from NOAA's Office for Coastal Management is utilized. Additional processes are used to depict the intertidal zone, remove values over the open ocean, and account for other geographic features. The map is then displayed on the NHC website in an interactive viewer.
4. Availability
When is the Map Issued?
NHC will release the initial map with the first issuance of a hurricane watch or warning or, in some special cases, a tropical storm watch or warning, for any portion of the Gulf or East Coast of the United States (anytime within 48 hours of the anticipated onset of tropical storm force winds). Once issued, the map will change every six hours in association with every new NHC full advisory package. The map will be available approximately 25 to 30 minutes following the availability of P-Surge 2.5, or about 60 to 90 minutes following the release of a full advisory. For more information about the timing of tropical cyclone advisories, please see the NHC Product Description Users Guide.
When active, the map will be available on the NHC website via an interactive viewer. GIS data will be available for download from hurricanes.gov/gis.
5. Examples
Interactive Example: An interactive example of the inundation graphic with full pan and zoom capability is available at the link below. Sample GIS data for the sample case is also available on that page.Interactive Example
Static Examples: These are static examples of the Potential Storm Surge Inundation Map. Note that the product will be interactive with pan and zoom capability. Example GIS datasets with metadata and instructions for displaying that data will be posted here and on the NHC GIS data webpage before June 1 2016.
6. Feedback and Comments
The NHC Storm Surge Unit is requesting your comments and feedback on the Potential Storm Surge Flooding Map. We encourage your comments or suggestions for future improvements, and your feedback will help us determine product utility and accuracy.
Please feel free to use any of the methods below for submitting comments.
Mailing Address
National Hurricane Center
Storm Surge Unit
11691 SW 17th Street
Miami, FL 33165