National Hurricane Center Forecast Verification
Contents
- Introduction
- Forecast verification procedures
- Annual NHC verification reports
- Official five-year mean errors and distributions
- Official error trends
- Model error trends
- NHC official forecast error database
- Performance measures and goals
- References
8. Performance measures and goals
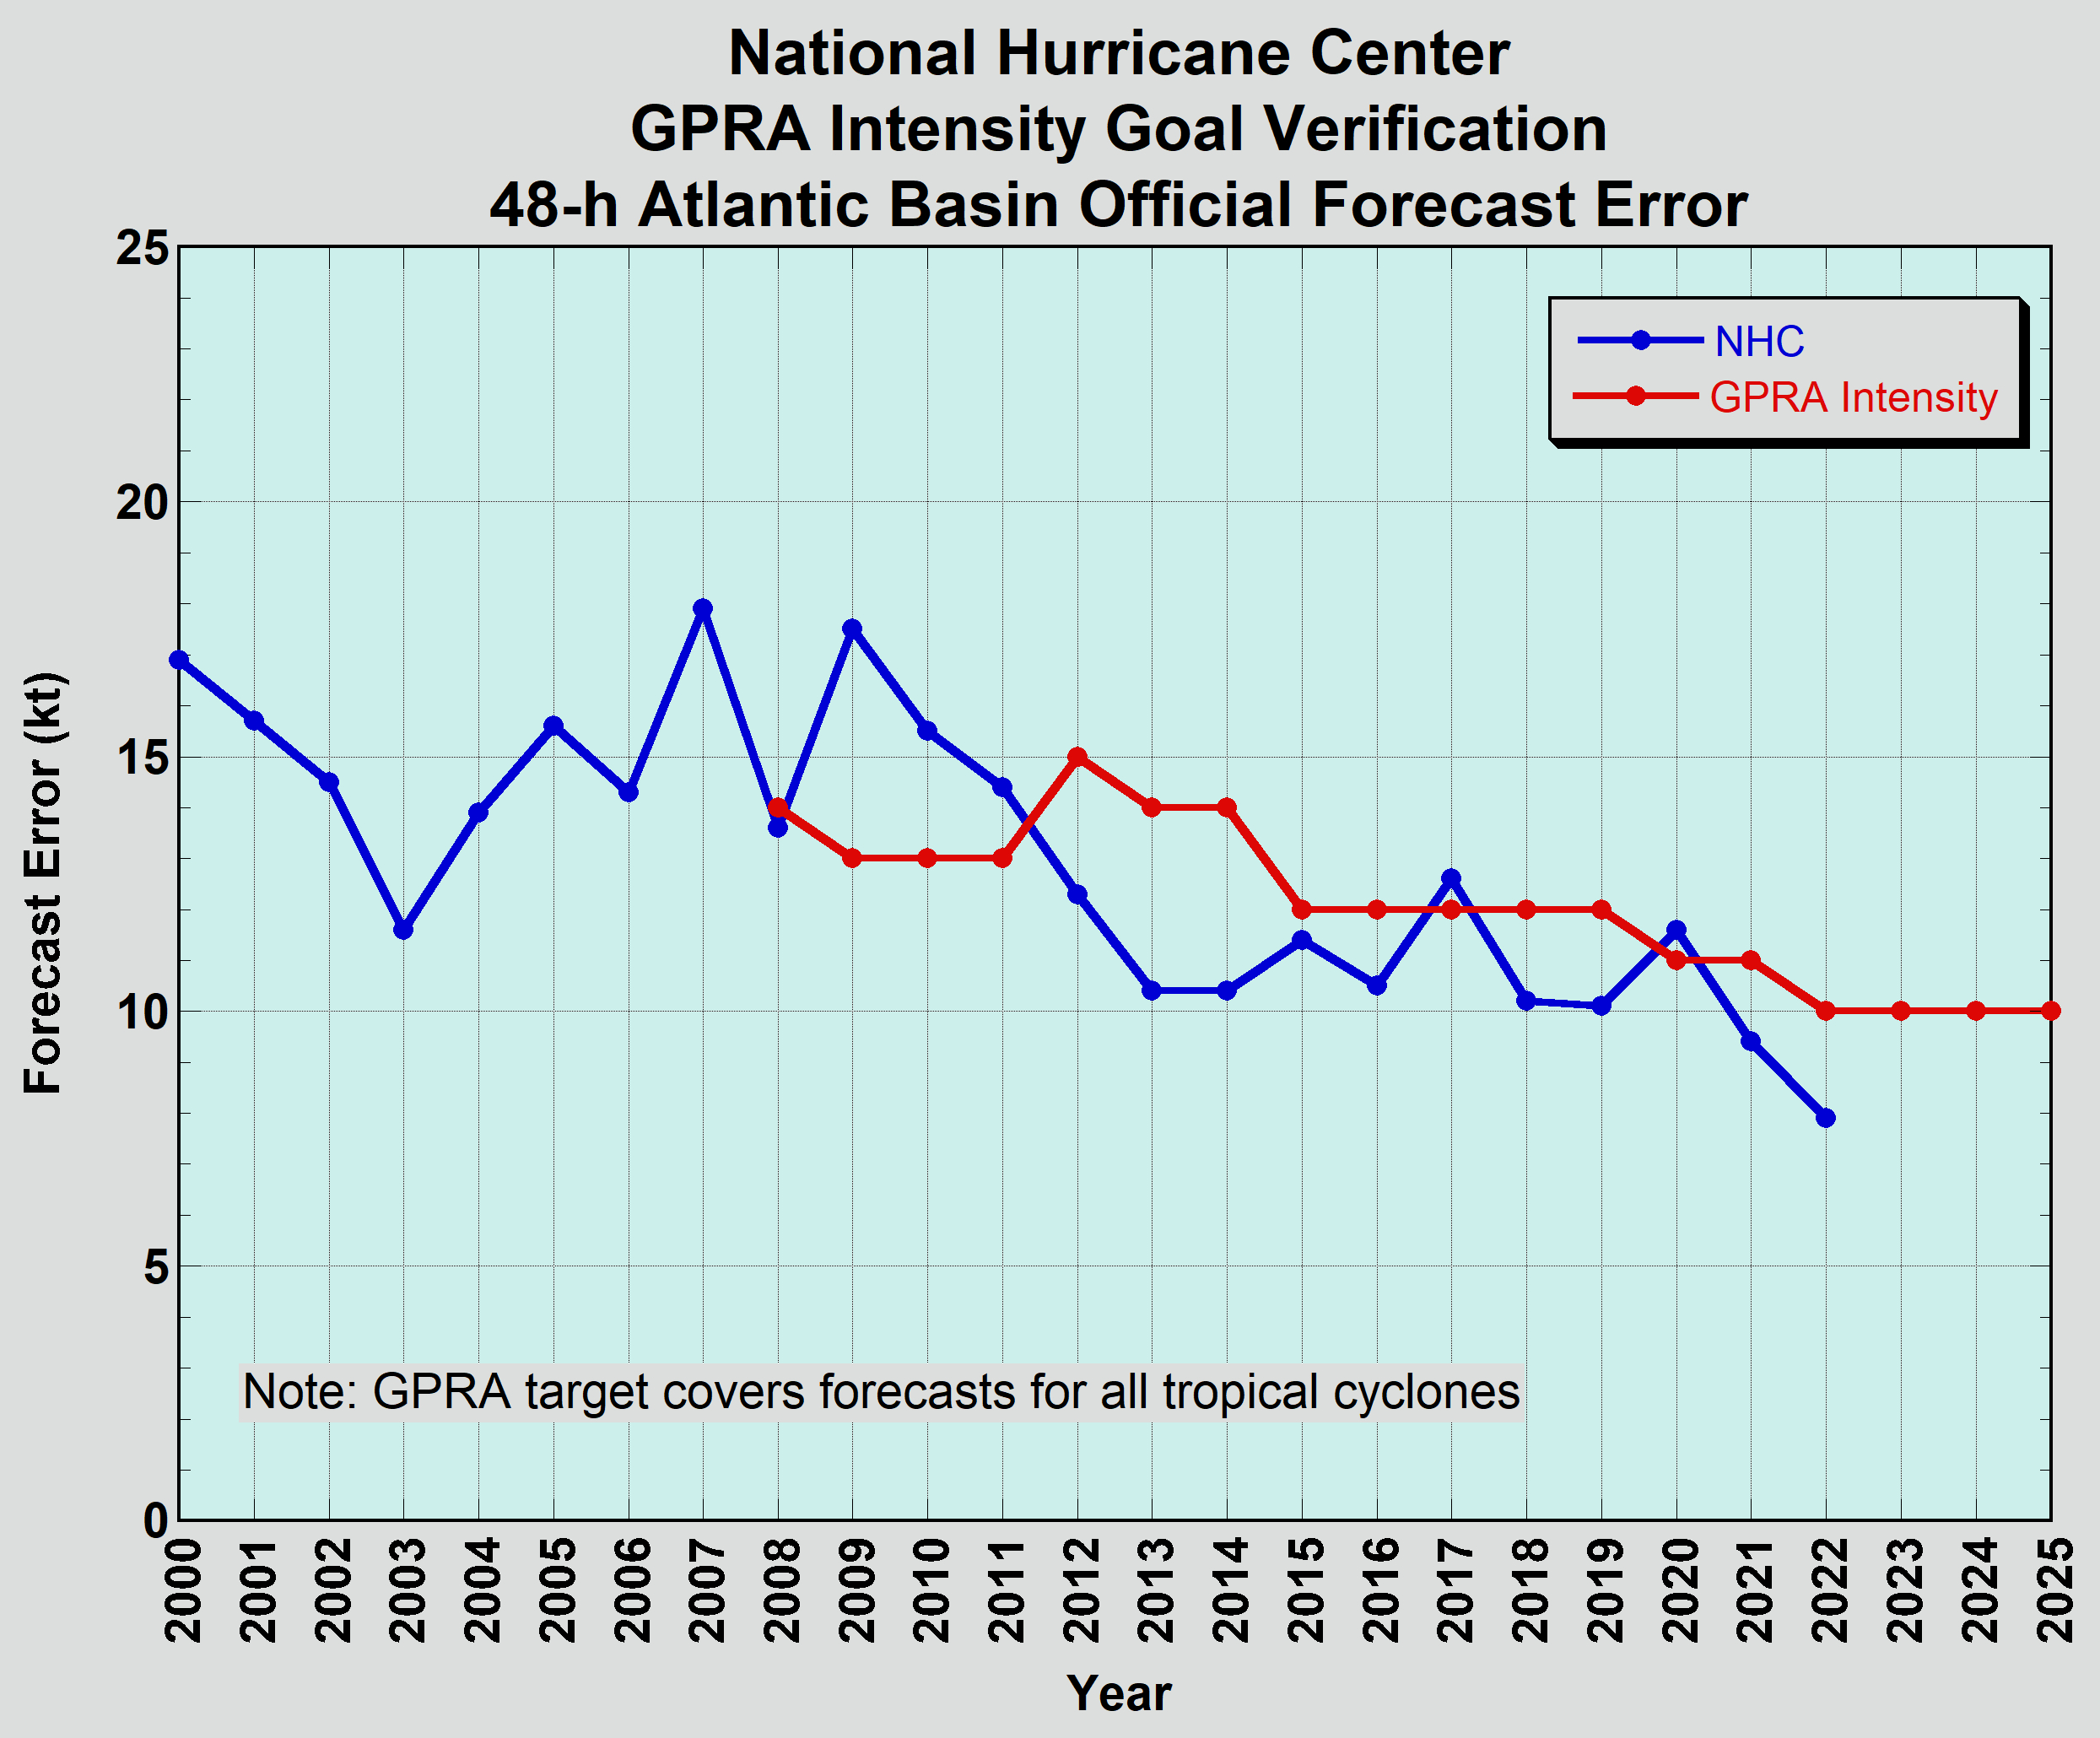
The NHC performance measures reported as part of the Government Performance and Results Act (GPRA) of 1993 are tabulated here. The current NHC measures are the annual average Atlantic basin 48-h track and intensity errors for all tropical cyclones. Prior to 2010, depressions were excluded from the track measure to facilitate examination of long-term trends. While the NHC produces forecasts for periods extending from 12 through 120 hours, the 48-hour forecast is often important for emergency managers and preparedness actions. Verification statistics for these measures are usually available by January or February of the following year. Diagrams of the performance measures are shown below.
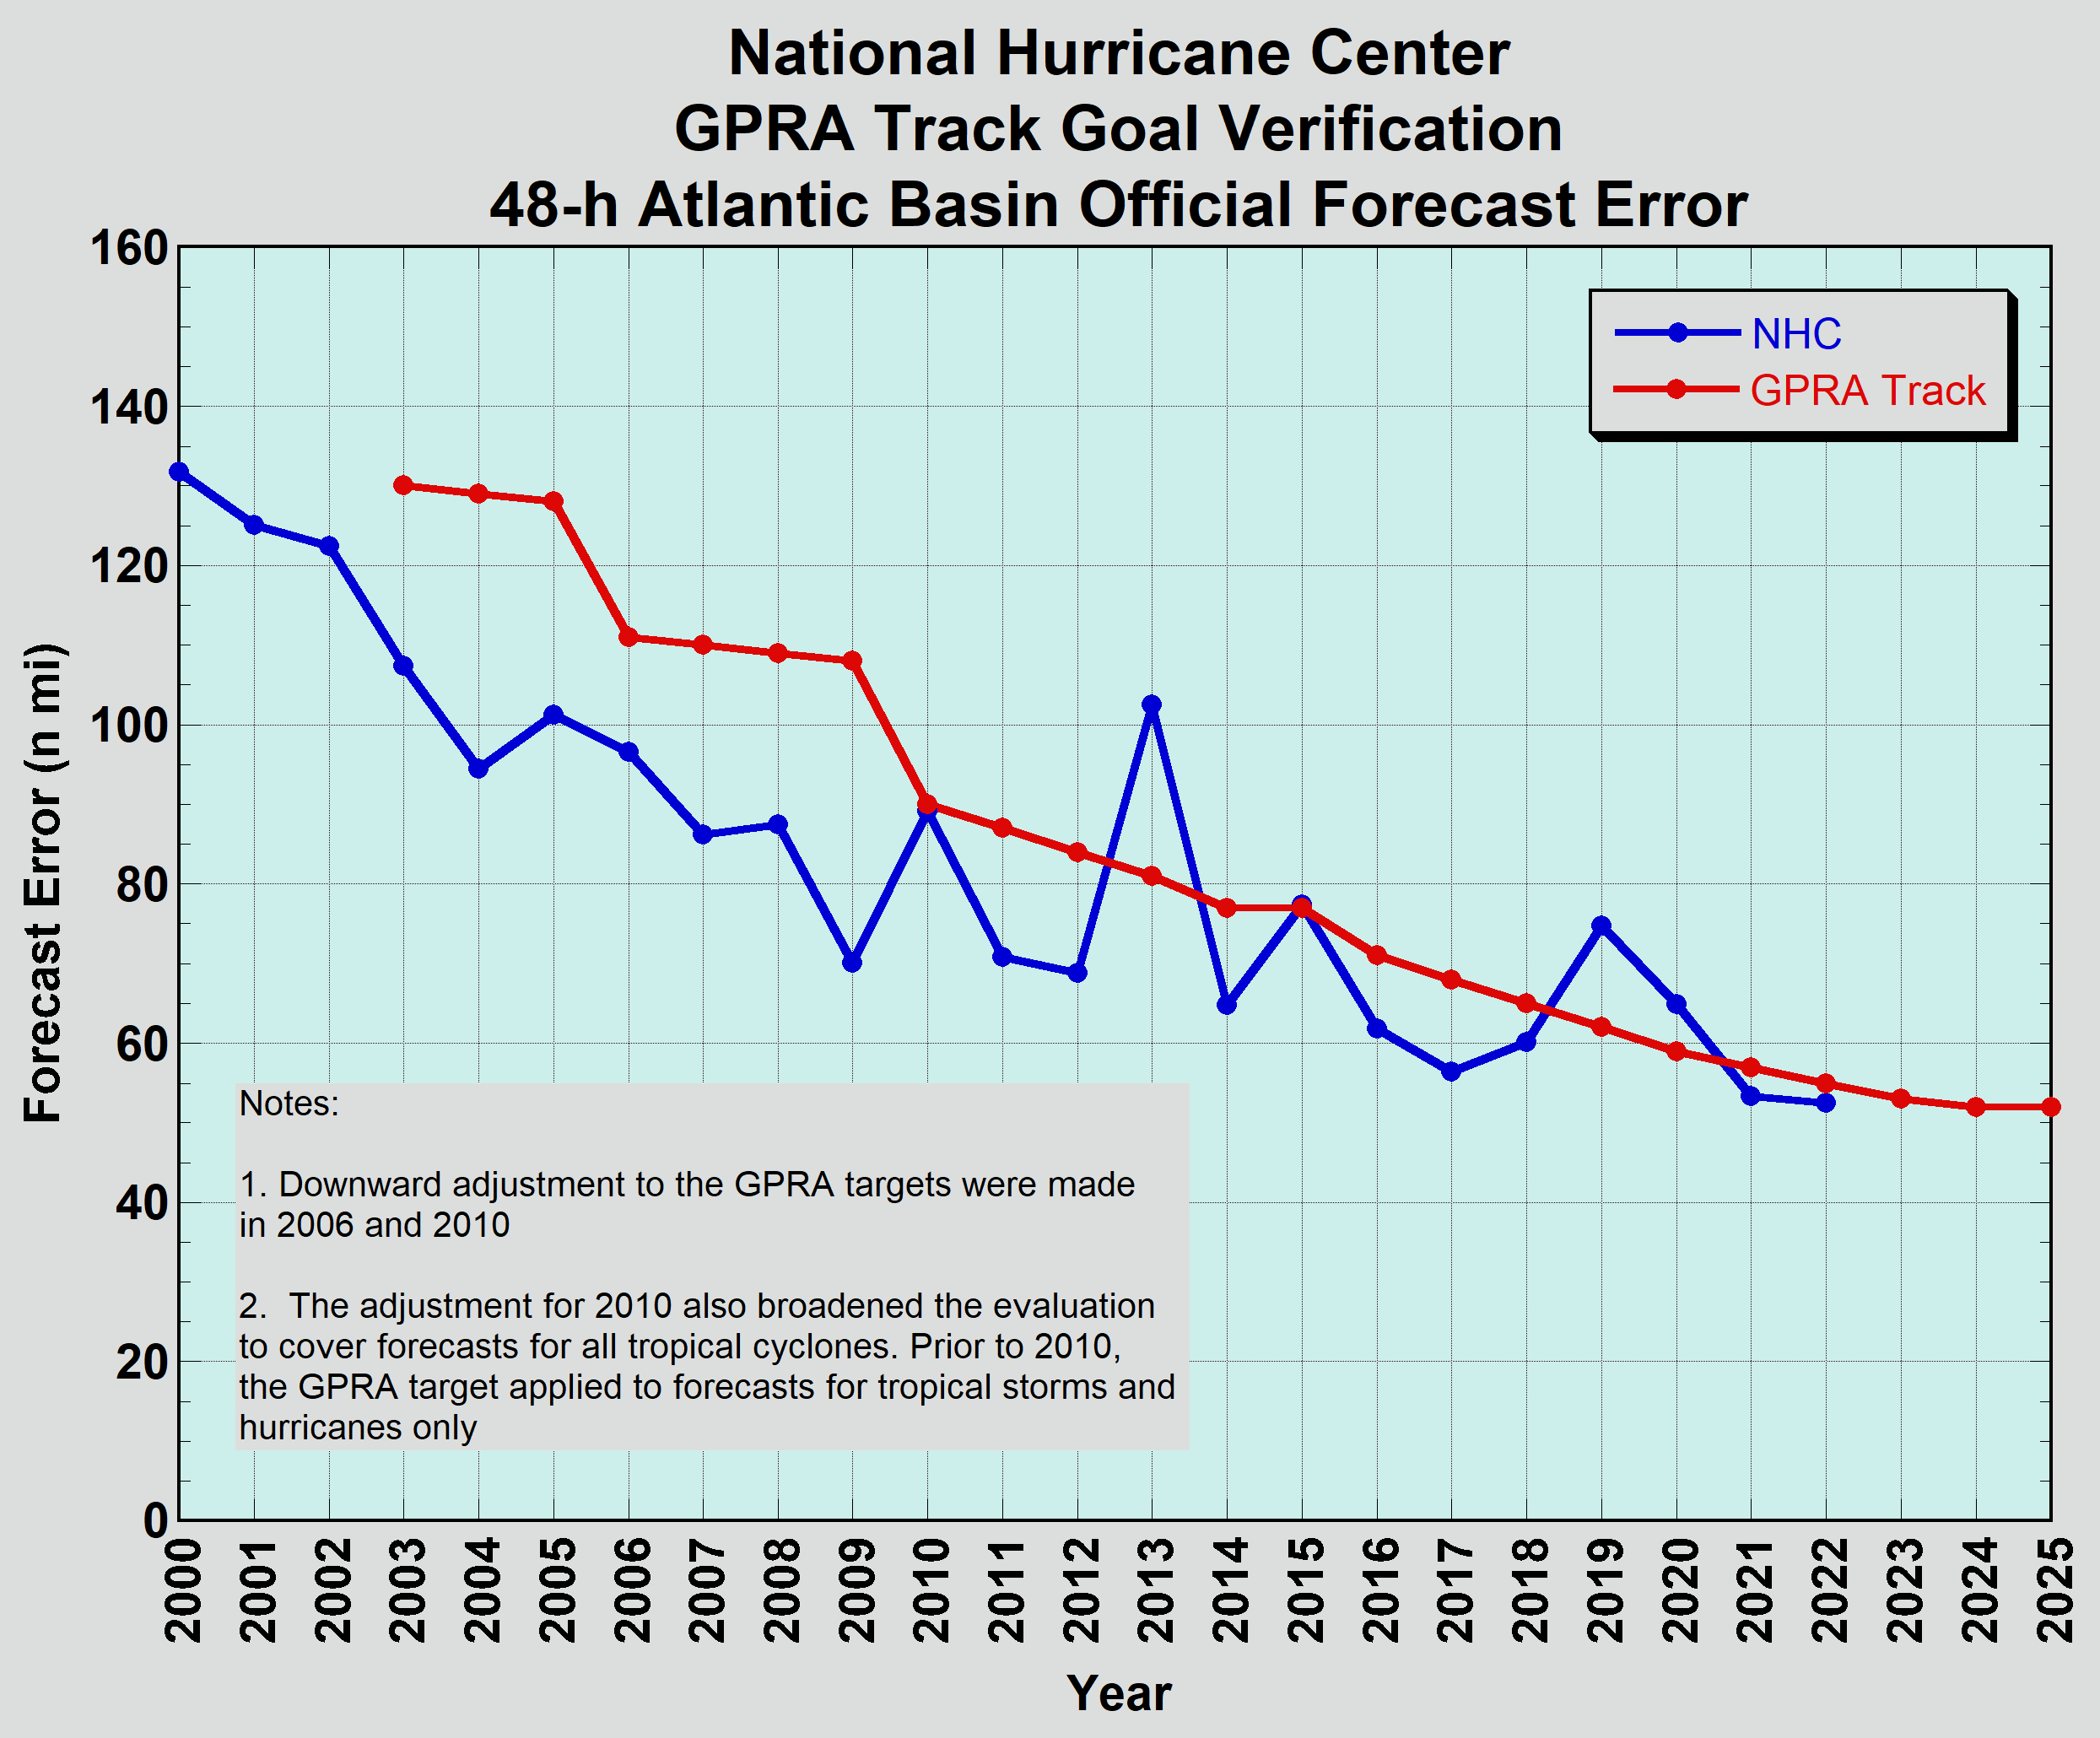
NHC GPRA track performance measure history.
Readers are reminded that due to natural volatility in tropical cyclone track characteristics, annual errors can vary significantly from year to year. In some of the past 20 years the average forecast errors have departed from the long-term trend line by as much as 50 nautical miles (or nearly 50%). Such aberrations are expected to continue. The number of storms each year can also vary greatly. Statistics for years with particularly few storms might not be representative or statistically significant. For these reasons it is usually not appropriate to extrapolate performance reported in one year to project performance the following year. Projections, such as this GPRA goal, are preferably based on long-term trends.
Next: References