National Hurricane Center Forecast Verification
Contents
- Introduction
- Forecast verification procedures
- Annual NHC verification reports
- Official five-year mean errors and distributions
- Official error trends
- Model error trends
- NHC official forecast error database
- Performance measures and goals
- References
6. Model error trends
Numerous objective forecast aids (guidance models) are available to help the NHC Hurricane Specialists in the preparation of their official track and intensity forecasts. Guidance models are characterized as either early or late, depending on whether or not they are available to the Hurricane Specialist during the forecast cycle. For example, consider the 1200 UTC (12Z) forecast cycle, which begins with the 12Z synoptic time and ends with the release of the official forecast at 15Z. The 12Z run of the NWS/Global Forecast System (GFS) model is not complete and available to the forecaster until about 16Z, or about an hour after the forecast is released - thus the 12Z GFS would be considered a late model since it could not be used to prepare the 12Z official forecast.
Multi-layer dynamical models are generally, if not always, late models. Fortunately, a technique can be used to take the latest available run of a late model and adjust its forecast to apply to the current synoptic time and initial conditions. In the example above, forecast data for hours 6-126 from the previous (06Z) run of the GFS would be adjusted, or shifted, so that the 6-h forecast (valid at 12Z) would exactly match the observed 12Z position and intensity of the tropical cyclone. The adjustment process creates an "early" version of the GFS model for the 12Z forecast cycle that is based on the most current available guidance. The adjusted versions of the late models are known, for historical reasons, as interpolated models.
A list of models is given in Table 4. In addition to their timeliness, models are characterized by their complexity or structure; this information is contained in the table for reference, but a complete description of the various model types is beyond the scope of this report. Additional information is given by DeMaria and Gross (2003) and here. Briefly, dynamical models solve the physical equations governing motions in the atmosphere. These may treat the atmosphere either as a single layer in the vertical (two-dimensional) or as having many layers (three-dimensional), and their domains may cover the entire globe or be limited to specific regions. Statistical models, in contrast, do not consider the physics of the atmosphere but instead are based on historical relationships between storm behavior and various other parameters. There is a class of statistical models that use output from dynamical models as well as historical data, and these hybrids are known as statistical-dynamical models. Similarly, statistical-synoptic hybrids use data from a current synoptic analysis. Consensus models are not true forecast models per se, but are merely combinations of results from other models. One way to form a consensus model is to simply average the results from a sample of models, but other, more complex techniques can give better results. For example, individual component models can be weighted or combined on the basis of past performance, or statistical corrections to historical biases can be made.
A fairly compete digital record of NHC model guidance exists for the period beginning in 1989. Digital records for earlier years have also been reconstructed for many guidance models. Two verifications from this record are presented here, a homogeneous comparison of early models beginning in 1994, and a non-homogeneous comparison of both early and late models dating back to 1970. A much more extensive discussion on this topic is given by DeMaria and Gross (2003). Additional model verifications can also be found in the annual NHC verification reports.
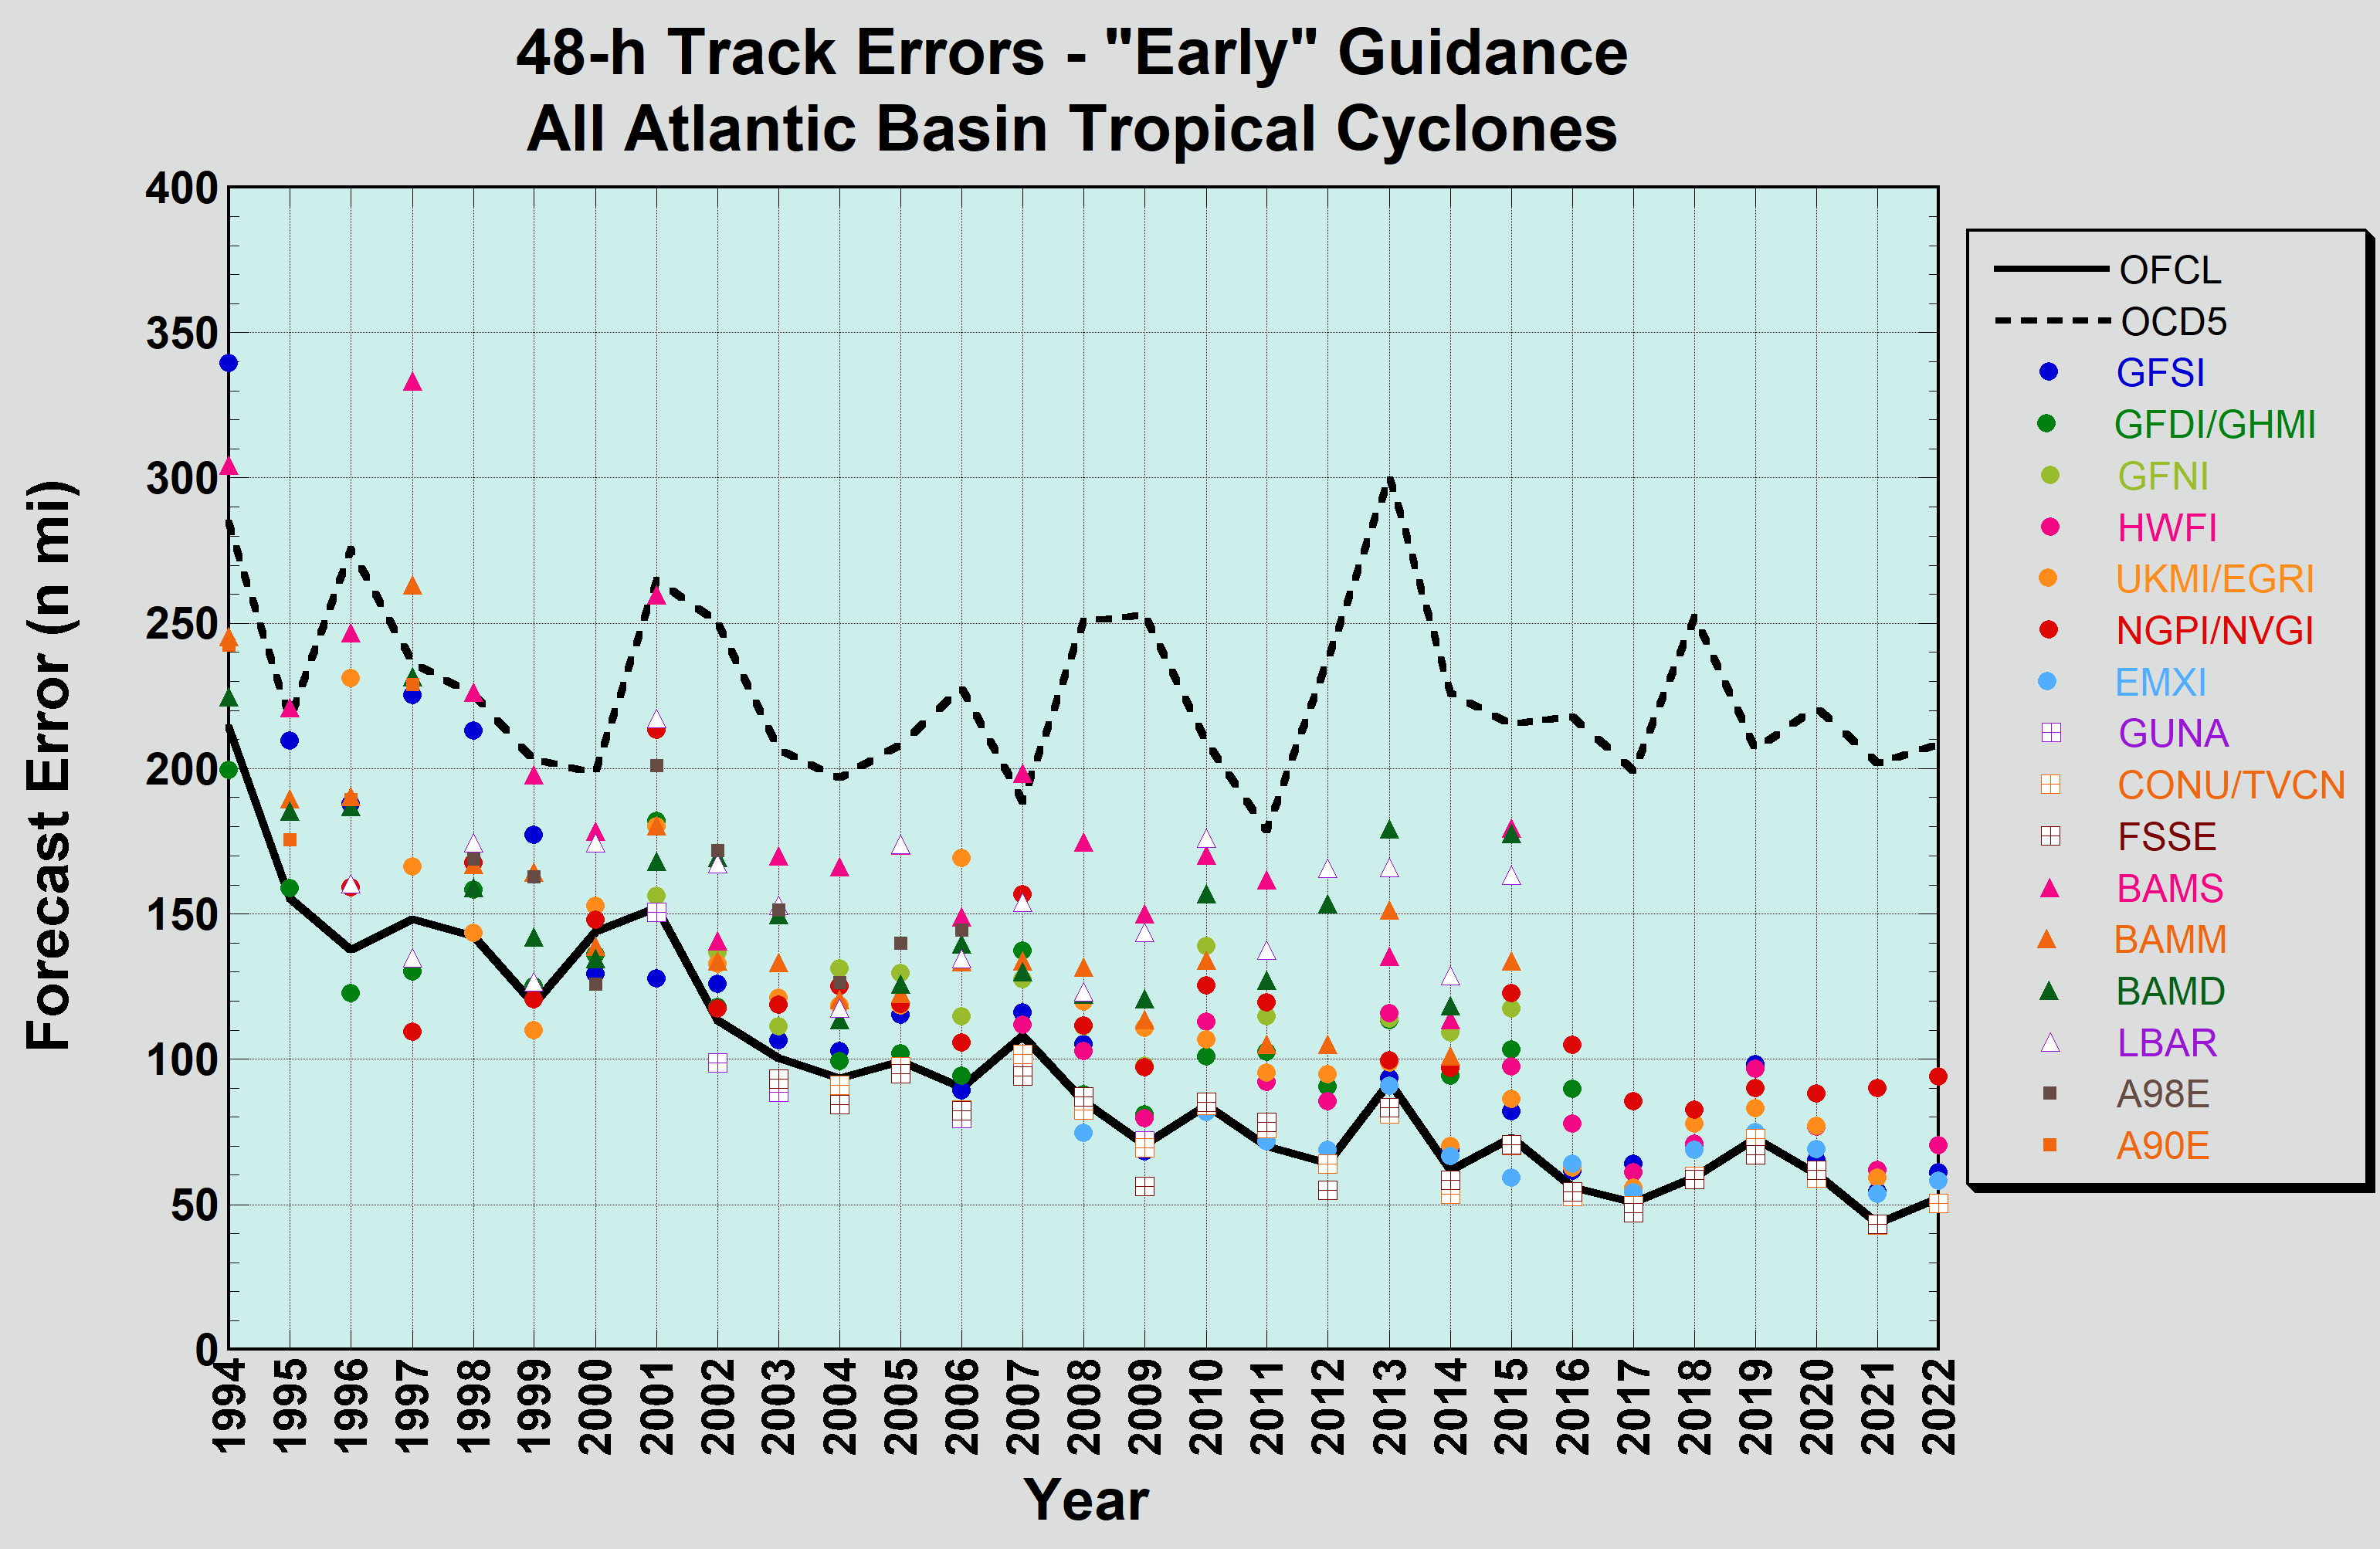
This figure shows a homogeneous comparison of early models for the period 1994-2024 (the practice of creating early versions of the late dynamical models began in 1994). A downward trend in model forecast error is evident in the figure. One can also see that the best performing model changes almost every year. It can also be seen that the accuracy of the official forecast is generally close to that of the best performing model in any given year. This is not because the forecasters are particularly skilled at identifying the best performing model in advance, but because the forecasters have long relied on a consensus or ensemble forecast philosophy, which tends to outperform even the best performing individual component of the ensemble. This philosophy was formalized in 2001 with the introduction of explicit consensus models into the operational guidance suite. Since their introduction, the consensus models have been the best performing track models, and they are expected to continue to excel in the future.
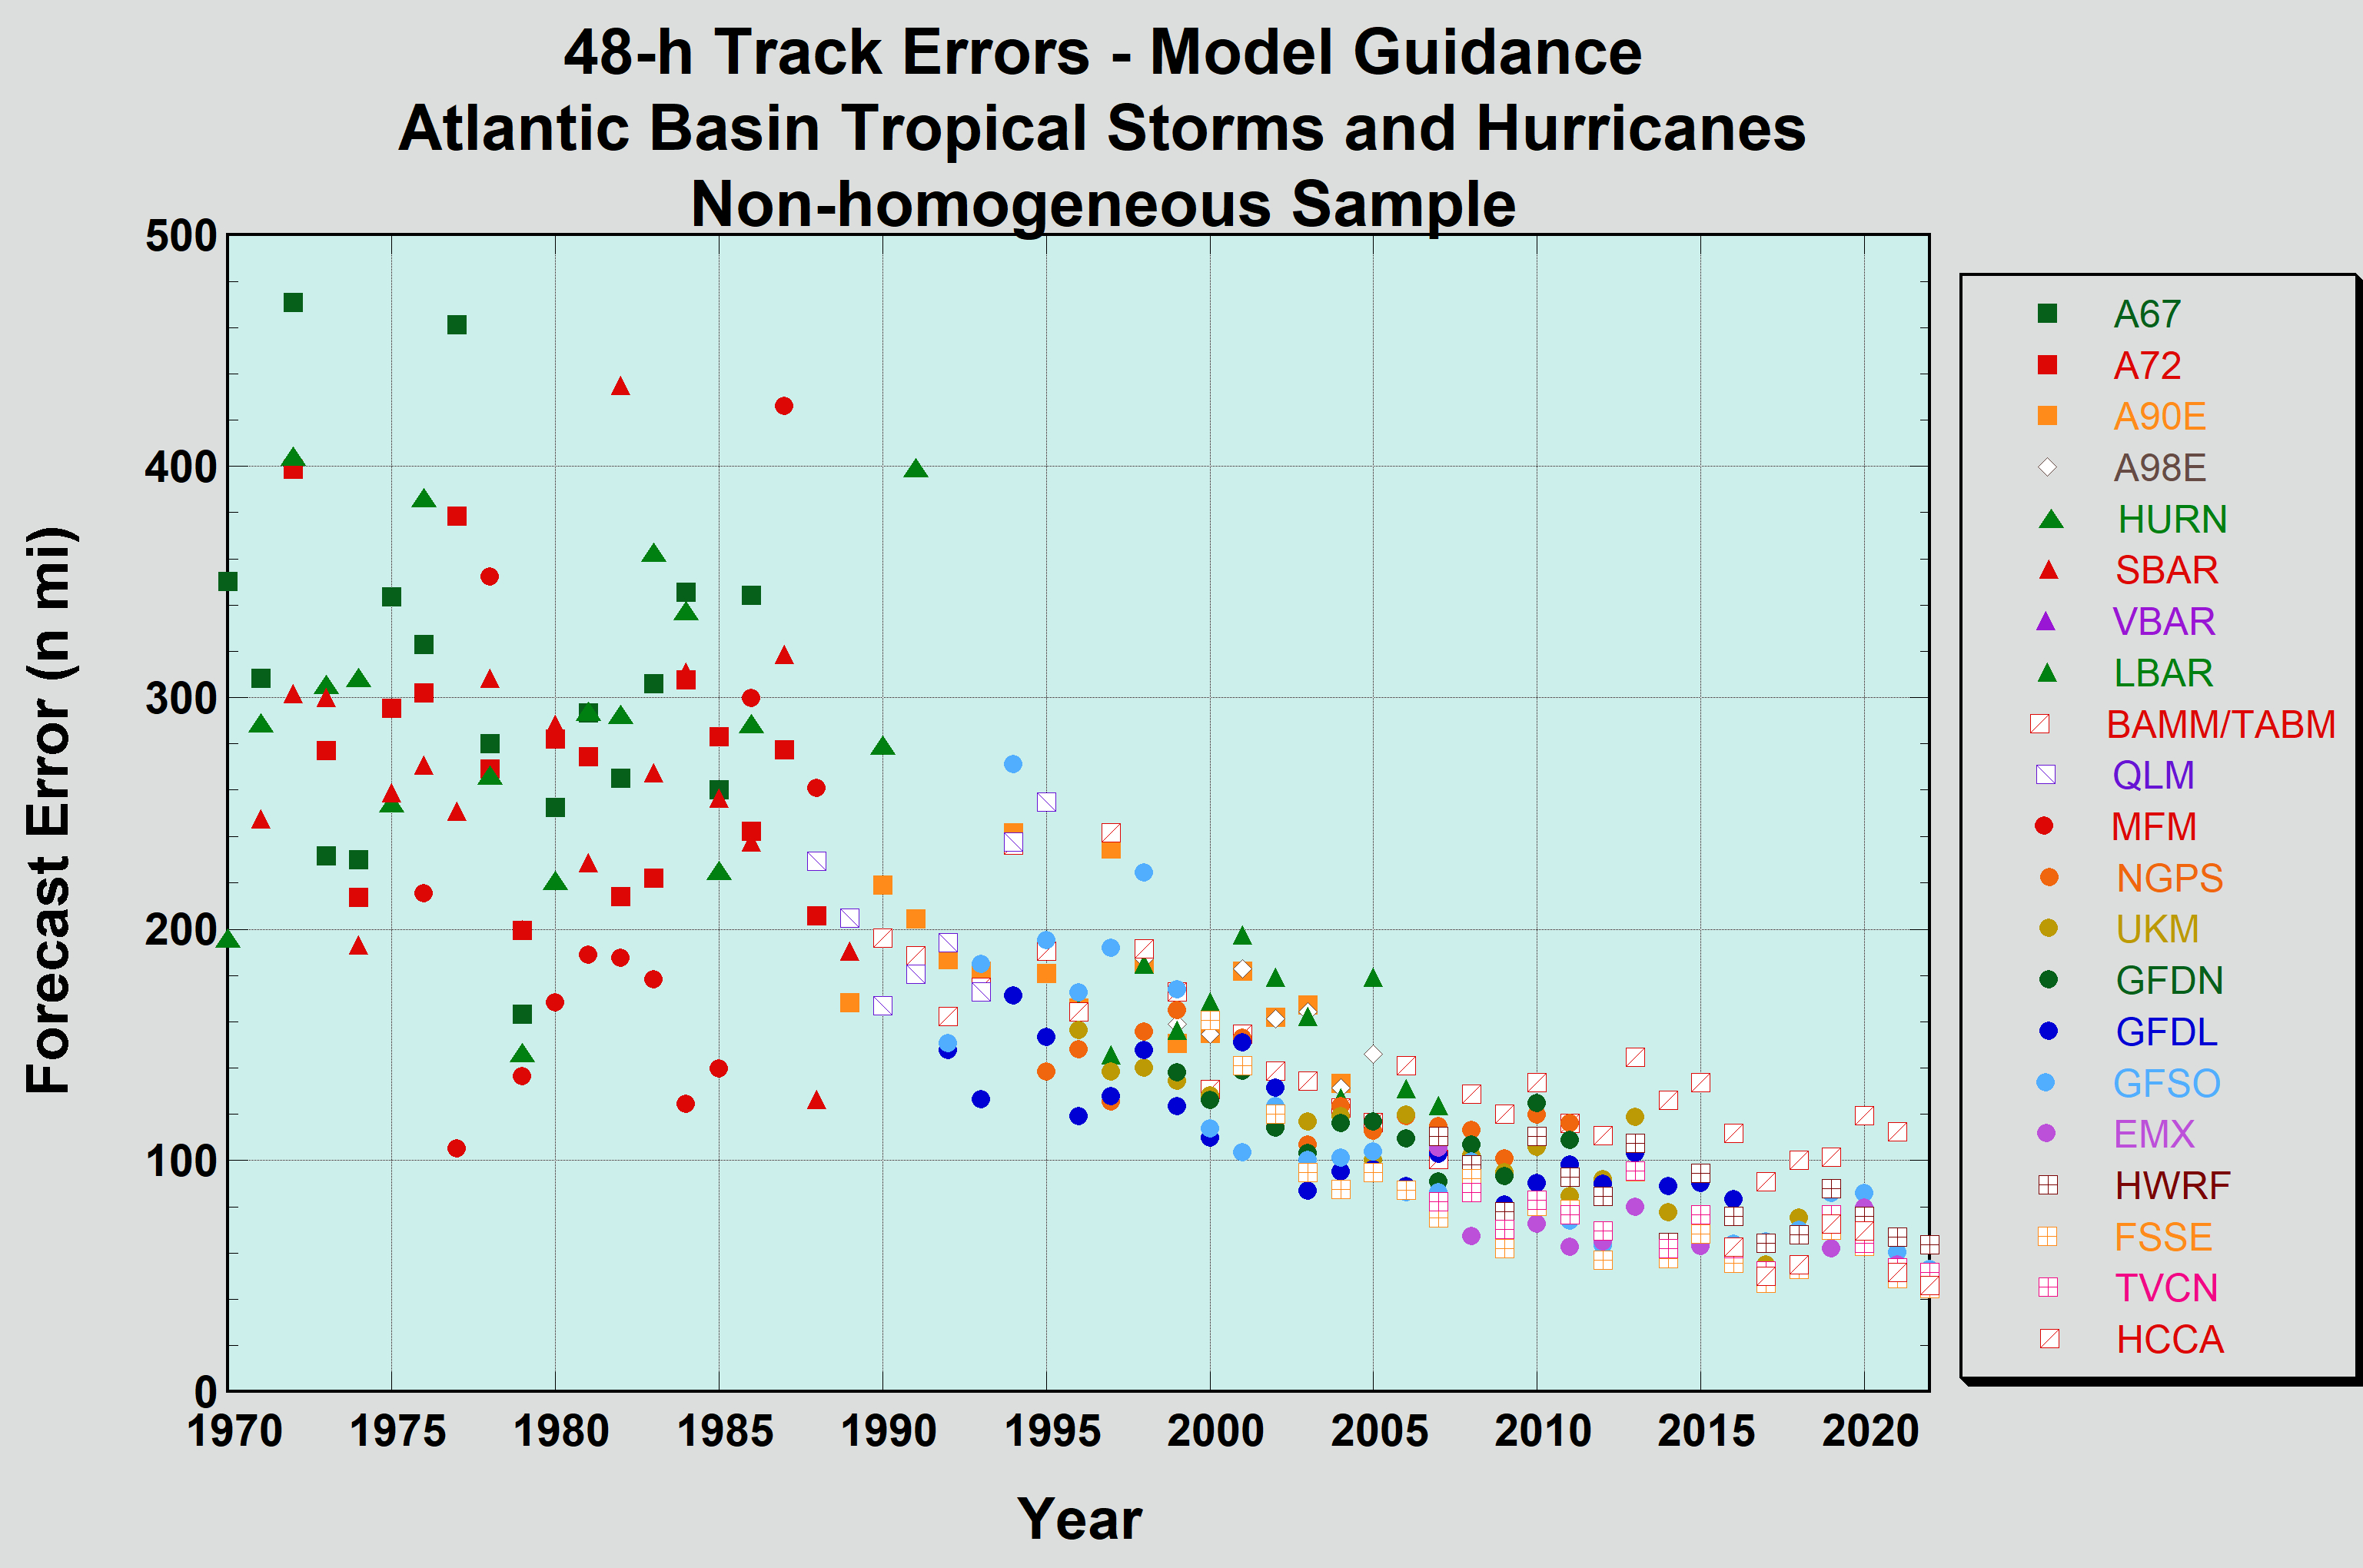
A longer history of track model guidance errors is shown here. This verification is non-homogeneous and includes both early and late models, meaning that these errors cannot be fairly compared either with each other or with the official forecast. However, such a verification does provide a general sense of the trends in model performance over time. It is interesting to note how the primary model types have changed over the years. In the early 1970's, statistical (and statistical hybrid) models, along with the simple barotropic SANBAR model, were the primary form of guidance. The 1980's saw the development of tropical cyclone forecast skill in the multi-level global dynamical models, although such guidance normally arrived too late to be directly used by forecasters. By the 1990's, the global models had improved and were providing consistently better guidance than either the statistical or the simpler dynamical models. And, as noted above, consensus models have been particularly strong performers in recent years.
It can also be seen from the figure that the variability in model accuracy (the spread between the best and worst performing models in a given year) has substantially decreased over the past 35 years. This is due in part to the retirement of poor-performing models (and model types) over time, but it may also reflect the changing nature of tropical cyclone activity during this period. In the 1970's and 80's, there was relatively little activity, and much of that activity was at higher latitudes, where forecasts generally have higher errors and more variability. Since the mid 1990s there have been more storms, particularly at low latitudes, leading to both more representative and more consistent error statistics.
| ID | Name/Description | Type | Timeliness (E/L) |
Parameters forecast |
|---|---|---|---|---|
| OFCL | Official NHC forecast | Trk, Int | ||
| CLP5 | CLIPER5 (Climatology and Persistence model) | Statistical baseline | E | Trk |
| SHF5 | SHIFOR5 (Climatology and Persistence model) | Statistical baseline | E | Int |
| DSF5 | Decay-SHIFOR5 (Climatology and Persistence model) | Statistical baseline | E | Int |
| OCD5 | CLP5 (track) and DSF5 (intensity) models merged | Statistical baseline | E | Trk, Int |
| HURN | HURRAN (retired) | Analog | E | Trk |
| A67 | NHC-67 (retired) | Statistical-synoptic | E | Trk |
| A72 | NHC-72 (retired) | Statistical-dynamical | E | Trk |
| A83 | NHC-83 (retired) | Statistical-dynamical | E | Trk |
| A90E | NHC90 (Atlantic) (retired) |
Statistical-dynamical | E | Trk |
| A98E | NHC98 (Atlantic) (retired) |
Statistical-dynamical | E | Trk |
| P91E | NHC91 (Pacific) (retired) |
Statistical-dynamical | E | Trk |
| BAMS | Beta and advection model (shallow layer) | Single-layer trajectory | E | Trk |
| BAMM | Beta and advection model (medium layer) | Single-layer trajectory | E | Trk |
| BAMD | Beta and advection model (deep layer) | Single-layer trajectory | E | Trk |
| SBAR | SANBAR (retired) | Single-layer regional dynamical | L | Trk |
| VBAR | VICBAR (retired) | Single-layer regional dynamical | L | Trk |
| LBAR | Limited area barotropic model (retired) |
Single-layer regional dynamical | E | Trk |
| QLM | Quasi-Lagrangian model (retired) | Multi-layer regional dynamical | L | Trk |
| MFM | Movable Fine Mesh model (retired) | Multi-level global dynamical | L | Trk |
| GFDL | NWS/Geophysical Fluid Dynamics Laboratory model | Multi-layer regional dynamical | L | Trk, Int |
| HWRF |
Hurricane Weather and Research
Forecasting model |
Multi-layer regional dynamical |
L |
Trk, Int |
| GFSO | NWS/Global Forecast System (formerly Aviation) | Multi-layer global dynamical | L | Trk, Int |
| UKM | United Kingdom Met Service model | Multi-layer global dynamical | L | Trk, Int |
| NGPS | Navy Operational Global Prediction System
(retired) |
Multi-layer global dynamical | L | Trk, Int |
| GFDN | Navy version of GFDL | Multi-layer regional dynamical | L | Trk, Int |
| CMC | Environment Canada global model | Multi-level global dynamical | L | Trk, Int |
| EMX | ECMWF global model | Multi-level global dynamical | L | Trk, Int |
| ETA | NWS/Eta (retired) |
Multi-level regional dynamical | L | Trk, Int |
| NAM | NWS/NAM | Multi-level regional dynamical | L | Trk, Int |
| AFW1 | Air Force MM5 (retired) |
Multi-layer regional dynamical | L | Trk, Int |
| OFCI | Previous cycle OFCL, adjusted | Interpolated | E | Trk, Int |
| GFDI | Previous cycle GFDL, adjusted | Interpolated-dynamical | E | Trk, Int |
| GHMI | Previous cycle GFDL, adjusted using modified intensity algorithm | Interpolated-dynamical | E | Trk, Int |
| HWFI |
Previous cycle HWRF, adjusted |
Interpolated-dynamical |
E |
Trk, Int |
| CTCI |
Previous cycle CTCX, adjusted |
Interpolated-dynamical |
E |
Trk, Int |
| GFSI | Previous cycle GFS, adjusted | Interpolated-dynamical | E | Trk, Int |
| UKMI | Previous cycle UKM, adjusted | Interpolated-dynamical | E | Trk, Int |
| NGPI | Previous cycle NGPS, adjusted (retired) |
Interpolated-dynamical | E | Trk, Int |
| GFNI | Previous cycle GFDN, adjusted | Interpolated-dynamical | E | Trk, Int |
| EMXI | Previous cycle EMX, adjusted | Interpolated-dynamical | E | Trk, Int |
| SHIP | Statistical Hurricane Intensity Prediction Scheme (SHIPS) | Statistical-dynamical | E | Int |
| DSHP | SHIPS with inland decay | Statistical-dynamical | E | Int |
| AEMN | GFS ensemble mean | Consensus | L | Trk, Int |
| GUNA | Avg of GFDI, UKMI, NGPI, GFSI | Consensus | E | Trk |
| TVCA | For 2024, avg of at least 2 of HWFI,
UKMI, GFSI, EMXI, CTCI (varies by year) |
Consensus | E | Trk |
| TVCE | For 2024, avg of at least 2 of HWFI,
UKMI, GFSI, EMXI, CTCI (varies by year) |
Consensus | E | Trk |
| TVCN | For 2024, avg of at least 2 of HWFI, UKMI, GFSI, EMXI, CTCI (varies by year) | Consensus | E | Trk |
| CGUN | Version of GUNA corrected for model biases | Corrected Consensus | E | Trk |
| TVCC | Version of TVCN corrected for model biases | Corrected Consensus | E | Trk |
| HCCA | HFIP Corrected Consensus Approach | Corrected consensus | E | Trk, Int |
| FSSE | FSU Super-ensemble | Corrected consensus | E | Trk, Int |
Next: NHC official forecast error database