


Eyewall Wind Profiles in Hurricanes Determined By GPS Dropwindsondes
James L. Franklin1, Michael L. Black2, and Krystal Valde1
1NOAA/NWS/TPC/National Hurricane Center, Miami, Florida
2NOAA/AOML/Hurricane Research Division, Miami, Florida
April 2000
1. Introduction
One of the more difficult problems for operational tropical cyclone forecasters is the assessment of the cyclone's maximum sustained surface wind. Even when aircraft reconnaissance data are available, these are typically obtained from the 700 mb (10,000 ft) level; from these flight-level observations, the forecaster is left to estimate the surface winds. Based on comparisons of flight-level and buoy data, Powell and Black (1990) recommended that a ratio of 63%-73% be used to reduce reconnaissance flight-level wind observations. While operational practices at the National Hurricane Center (NHC) have varied over time, in recent years surface winds have typically been taken to be 80%-90% of the flight-level wind. In view of studies such as Powell and Black, use of these relatively high ratios has periodically resulted in criticism of NHC intensity estimates.
In 1997, the National Oceanic and Atmospheric Administration (NOAA) and Air Force Reserve Command (AFRC) hurricane reconnaissance aircraft began to deploy Global Positioning System (GPS)-based dropwindsondes (Hock and Franklin 1999) in the hurricane eyewall. These instruments provide for the first time, detailed, accurate profiles (15 ft vertical resolution, with 1-4 mph accuracy) of the inner core of a hurricane from flight level (typically 700 mb) down to the surface. More than 350 such profiles have been obtained through the 1999 hurricane season.
For this report we use the dropsonde data to document the mean structure of the lowest 10,000 ft of the hurricane eyewall, and discuss the implications for operational reductions of reconnaissance observations.
2. Data and Methodology
This study is based on a sample of 357 quality-controlled eyewall profiles from the following hurricanes: Guillermo and Erika in 1997; Bonnie, Danielle, Georges, Mitch, Lester, and Madeline in 1998; and Bret, Dennis, Floyd, Gert, Irene, Jose, Lenny, Dora and Eugene in 1999. A majority of these dropsonde releases were made from the 700 mb level. For sondes released from NOAA aircraft, airborne radar was used to determine whether a particular sonde was released in the eyewall; for AFRC sondes we relied on the comments of the operational air-crews, as well as examination of flight-level wind profiles.
The individual soundings have been used to construct a mean eyewall profile for the data set. Prior to the averaging, the wind at each level in the drop profile is normalized by the wind speed at 700 mb (10,000 ft).
3. Results
Figure 1 shows the mean eyewall wind speed profile, where the wind at each level has been normalized by the wind speed at 700 mb (taken from the dropsonde profile, if available, or from the aircraft 700 mb flight-level wind at the time of launch, if not). The strongest winds in the eyewall are found near 500 m (1600 ft) elevation; these are about 20% higher than the 700 mb wind, owing to the warm-core nature of the tropical cyclone. For comparison, the mean profile for non-eyewall sondes within 200 miles of the cyclone center is also shown. In the outer part of the vortex, the low-level wind maximum is found at a somewhat higher elevation and is not as pronounced as in the eyewall. The ratio of the surface to 700 mb wind (R700) is 0.78 in the outer vortex and 0.91 in the eyewall. Note that the former figure is not far from Powell and Black's (1990) estimate of 0.73. This is not surprising given that their sample was comprised almost exclusively of outer vortex observations.
The outward slope of the radius of maximum wind (RMW) in the hurricane eyewall with height causes the value R700 = 0.91 given above to be biased slightly high, since many sondes are released inward of the flight-level RMW in an attempt to measure the maximum surface winds. When R700 is evaluated only from sondes at the RMW a value of 0.88 is obtained. This value should represent a lower bound on R700, placing the true value of R700 between 0.88 and 0.91. Thus at least in the mean, the dropsonde data confirm NHC's operational practice for the reduction of aircraft reconnaissance data.
While a reduction factor of about 0.9 may be appropriate in the mean, individual eyewall profiles illustrate how difficult it can be to estimate a hurricane's maximum surface winds from flight-level reconnaissance data. Figure 2 show an example from 1998's Hurricane Mitch. Over a period of several hours, the NOAA Hurricane Hunter aircraft could find flight-level winds no higher than 150 mph, yet this and several other dropsondes indicated much higher wind speeds near the surface. In this case, Mitch appeared to be weakening from the "top-down"; the circulation at flight-levels was decreasing but this trend had not yet begun at the surface. On the other hand, several storms (including Bonnie) have shown surface winds much lower than the flight-level wind.
4. Operational Recommendations
Based on these and similar analyses for other normalization altitudes, the following reduction factors are recommended for reducing flight-level winds in the inner core of a tropical cyclone to the surface (33 ft) level: for the 700 mb level, R = 0.90; for the 850 mb level (commonly flown in tropical storms), R = 0.80. For investigative flights at 1,000 ft, R = 0.85. As significant variations from these means have been noted in individual storms; these guidelines can be modified as conditions warrant. Storm-to-storm variability will primarily be influenced by wind speed, cyclone convective intensity, and sea-surface temperature.
The mean eyewall profile (Fig. 1) has implications for high-rise buildings and elevated terrain. Table 1 gives the wind at various altitudes as a percentage of the surface wind. Winds at the top of a 30-story building will average about 20 mph (one Saffir-Simpson category) higher than at the surface. This can be seen in an example from Hurricane Georges (Fig. 3). In this case, the surface winds are near the lower end of Category Three; yet at an altitude of 300 ft the winds are now in the middle of Category Four.
5. References
Powell, M. D. and P. G. Black, 1990: The relationship of hurricane reconnaissance flight-level wind measurements to winds measured by NOAA's oceanic platforms. J. Wind Engineering and Industrial Aerodynamics, 36, 381-392.
Hock, T. F., and J. L. Franklin, 1999: The NCAR GPS dropwindsonde. Bull. Amer. Meteor. Soc., 80, 407-420.
| Height (ft) |
# Storys |
Wind (% surface) |
Pressure Force (% surface) |
|---|---|---|---|
| 33 (sfc) | 3 | 100 | 100 |
| 50 | 5 | 103 | 106 |
| 100 | 10 | 108 | 117 |
| 150 | 15 | 111 | 123 |
| 200 | 20 | 115 | 132 |
| 250 | 25 | 117 | 137 |
| 300 | 30 | 119 | 142 |
| 400 | 40 | 121 | 146 |
| 500 | 50 | 123 | 151 |
| 600 | 60 | 125 | 156 |
| 750 | 75 | 128 | 164 |
| 1000 | 100 | 131 | 172 |
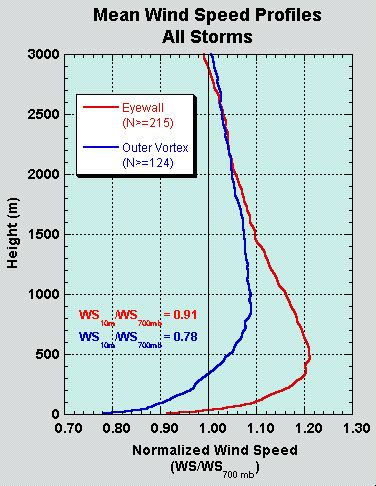
Figure 1. Mean wind speed profile (normalized by 700 mb wind speed) for eyewall and outer vortex soundings.
Figure 2. Wind speed profile from the eyewall of Hurricane Mitch at 2337 UTC 27 October 1998. Vertical lines indicate the boundaries of Saffir-Simpson Hurricane Scale categories. Sloping dashed line indicates the peak flight-level wind found during the reconnaissance flight, and its conversion to an assumed surface wind using a 0.9 reduction factor.
Figure 3. Wind speed profile from the eyewall of Hurricane Georges at 1959 UTC 19 September 1998. Vertical lines indicate the boundaries of Saffir-Simpson Hurricane Scale categories.