


Experimental Tropical Rainfall Product Description
Contents
1. Overview
This information is also available in PDF format: http://products.weather.gov/PDD/PDD%20TC%20Satellite%20Rainfall%20Graphic%20Experimental_April%2015-1.pdf
The National Hurricane Center's (NHC) Tropical Analysis and Forecast Branch (TAFB) is providing, on an experimental basis, event-driven satellite-based 6-hour Quantitative Precipitation Estimates (QPE) in both text and graphical form as well as model-derived 24-hour Quantitative Precipitation Forecasts (QPF) for tropical cyclones and tropical disturbances affecting areas within the National Hurricane Center (NHC) and Central Pacific Hurricane Center (CPHC) areas of responsibility. The experimental product represents an improvement over the existing NHC Satellite Rainfall Estimate product which is based on the Griffith-Woodley technique developed in the 1970s. A description of the current operational NHC Satellite Rainfall Estimate product can be found on the NHC webpage at the following URL: http://www.nhc.noaa.gov/abouttafbprod.shtml#SRE
2. Product Description
The Experimental Satellite Quantitative Precipitation Estimate (QPE) and Quantitative Precipitation Forecast (QPF) Webpage hosts event-driven satellite-based 6-hour QPEs in both text and graphical form as well as a model-derived 24-hour QPF graphics for tropical cyclones and tropical disturbances. The experimental satellite QPE product is a text product that provides 6-hour estimates of the amount of rain that has fallen from a tropical cyclone or disturbance impacting land and the distribution of that rain. The product is generated when model guidance is initiated by the U.S. National Hurricane Center (NHC) or the Central Pacific Hurricane Center (CPHC) for a tropical disturbance or cyclone in the North Atlantic, eastern North Pacific or central North Pacific basins. The product may also be generated for tropical disturbances that are heavy rainfall producers over land but are not anticipated to become tropical cyclones in the next few days. The product consists of Satellite-based Rainfall Estimates (SREs) valid over the same 6-hour period from the U.S. Naval Research Laboratory (NRL) and NOAA's Climate Prediction Center (CPC) as well as a recent forecast from the Global Forecast System (GFS) model in a text table and an accompanying graphic that are centered over the storm. In addition, the experimental product webpage provides a graphic than contains 24-hour quantitative precipitation forecasts (QPF) from the Princeton Geophysical Fluid Dynamics (GFDL) and NOAA Hurricane Weather Research and Forecast (HWRF) models as well as the GFS. The bottom of the webpage displays a number of links to rainfall analysis and guidance products from U.S. weather services that may be helpful to our partners.
3. Methodology
The NHC experimental satellite QPE text product offers six-hour QPEs derived from both the NRL-Blend Satellite Rainfall Estimate (SRE) technique provided by the U.S. Naval Research Laboratory and the QMORPH SRE technique provided by NOAA's Climate Prediction Center. These SRE techniques incorporate both geostationary and microwave satellite imagery to generate precipitation estimates within a few hours of real-time. This is seen as an improvement over the Griffith-Woodley technique used to generate the current NHC Satellite Rainfall Estimate Product. Descriptions of these three SRE techniques can be found here. In addition, the experimental text product provides a rainfall forecast from a recent run of the Global Forecast (GFS) model that spans the same 6-hour period as the satellite-based estimates. The initialization time of the GFS run is specified in the text product. Information on the GFS model can be found here. The location of the tropical cyclone or disturbance at the most recent synoptic time is provided by NHC or CPHC forecasters and is used as the center point for 6� latitude by 6� longitude tables created for each of the rainfall estimate methods. A range of precipitation values is specified in millimeters for each 1� bin within each table. In addition to the tables, the experimental text product provides the amount and location of the 6-hour and 24-hour precipitation maxima determined by each of the three methods. These values are rounded to the nearest 10 millimeters. Differences between the estimates provided by the three methods indicate uncertainty in the amount of rain received. A complimentary 6-hr QPE graphic, also centered on the forecaster identified center point of the tropical cyclone or disturbance, is created for an area spanning 5� latitude by 5� longitude. In addition, the experimental product webpage provides a graphic that contains 24-hour quantitative precipitation forecasts (QPFs) from the Princeton Geophysical Fluid Dynamics (GFDL) and NOAA Hurricane Weather Research and Forecast (HWRF) models as well as the GFS. The HWRF and GFDL components of this graphic will only be available for tropical cyclones and disturbances that are being monitored for tropical cyclone development. The GFS alone will be available for tropical disturbances that are expected to be heavy rainfall producers over land, but are not expected to become tropical cyclones.
4. Availability
The NHC operational 6-hour QPE text product and corresponding graphic as well as the model-based 24-hour QPF graphic are available four times a day when there are active tropical cyclones and/or tropical disturbances. They are posted to the web at approximately 0400, 1000 1600 and 2200 UTC. URL for experimental satellite rainfall QPEs: http://www.nhc.noaa.gov/experimental/rainfall
5. Examples
Examples of the NHC experimental 6-hour satellite QPE text product and the corresponding graphic as well as the 24-hour quantitative precipitation forecast graphic are provided below.
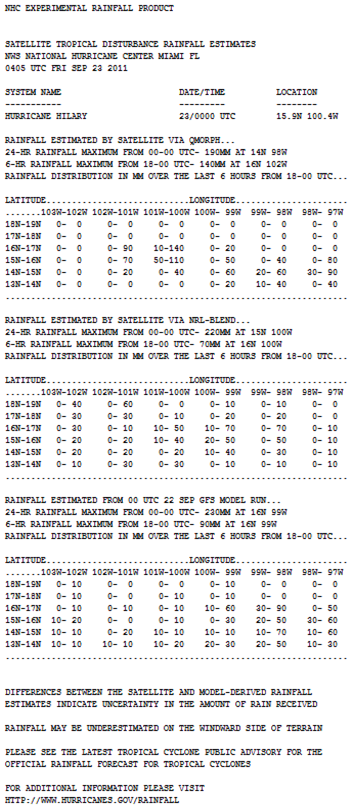
Figure 1. An example of the experimental 6-hour satellite QPE text product. Each of the tables in the product describes the distribution of rainfall over the 6-hr period ending at the date/time noted at the top of the product based on a different method of rainfall estimation. In addition, the text product provides the amount and location of the 6-hour and 24-hour precipitation maxima determined by each of the three methods. The first table in the product is derived from the QMORPH SRE technique, the second table is derived from the NRL-Blend technique, and the third table is derived from the rainfall forecast from a recent run of the GFS forecast models.
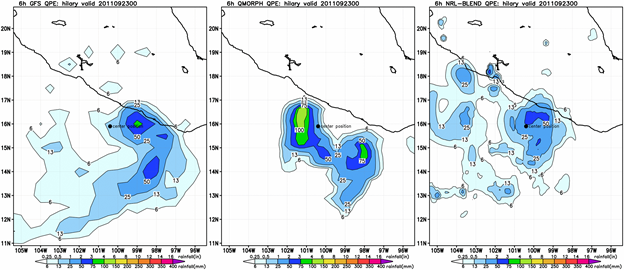
Figure 2. An example of the experimental 6-hour satellite QPE graphic that corresponds to the text product in Figure 1. Each of the panels in the graphic describes the distribution of rainfall over the 6-hour period ending at the date/time noted at the top of the product based on a different method of rainfall estimation. The first panel in the graphic is derived from the rainfall forecast from a recent run of the GFS forecast model, the middle panel is derived from the QMORPH SRE technique, and the third panel is derived from NRL-Blend SRE technique. In the examples seen in Figure 2, the graphic is valid at "2011092300" and shows the QPEs from each of the three methods for the 6-hour period from 1800 UTC 22 September 2011 to 0000 UTC 23 September 2011.
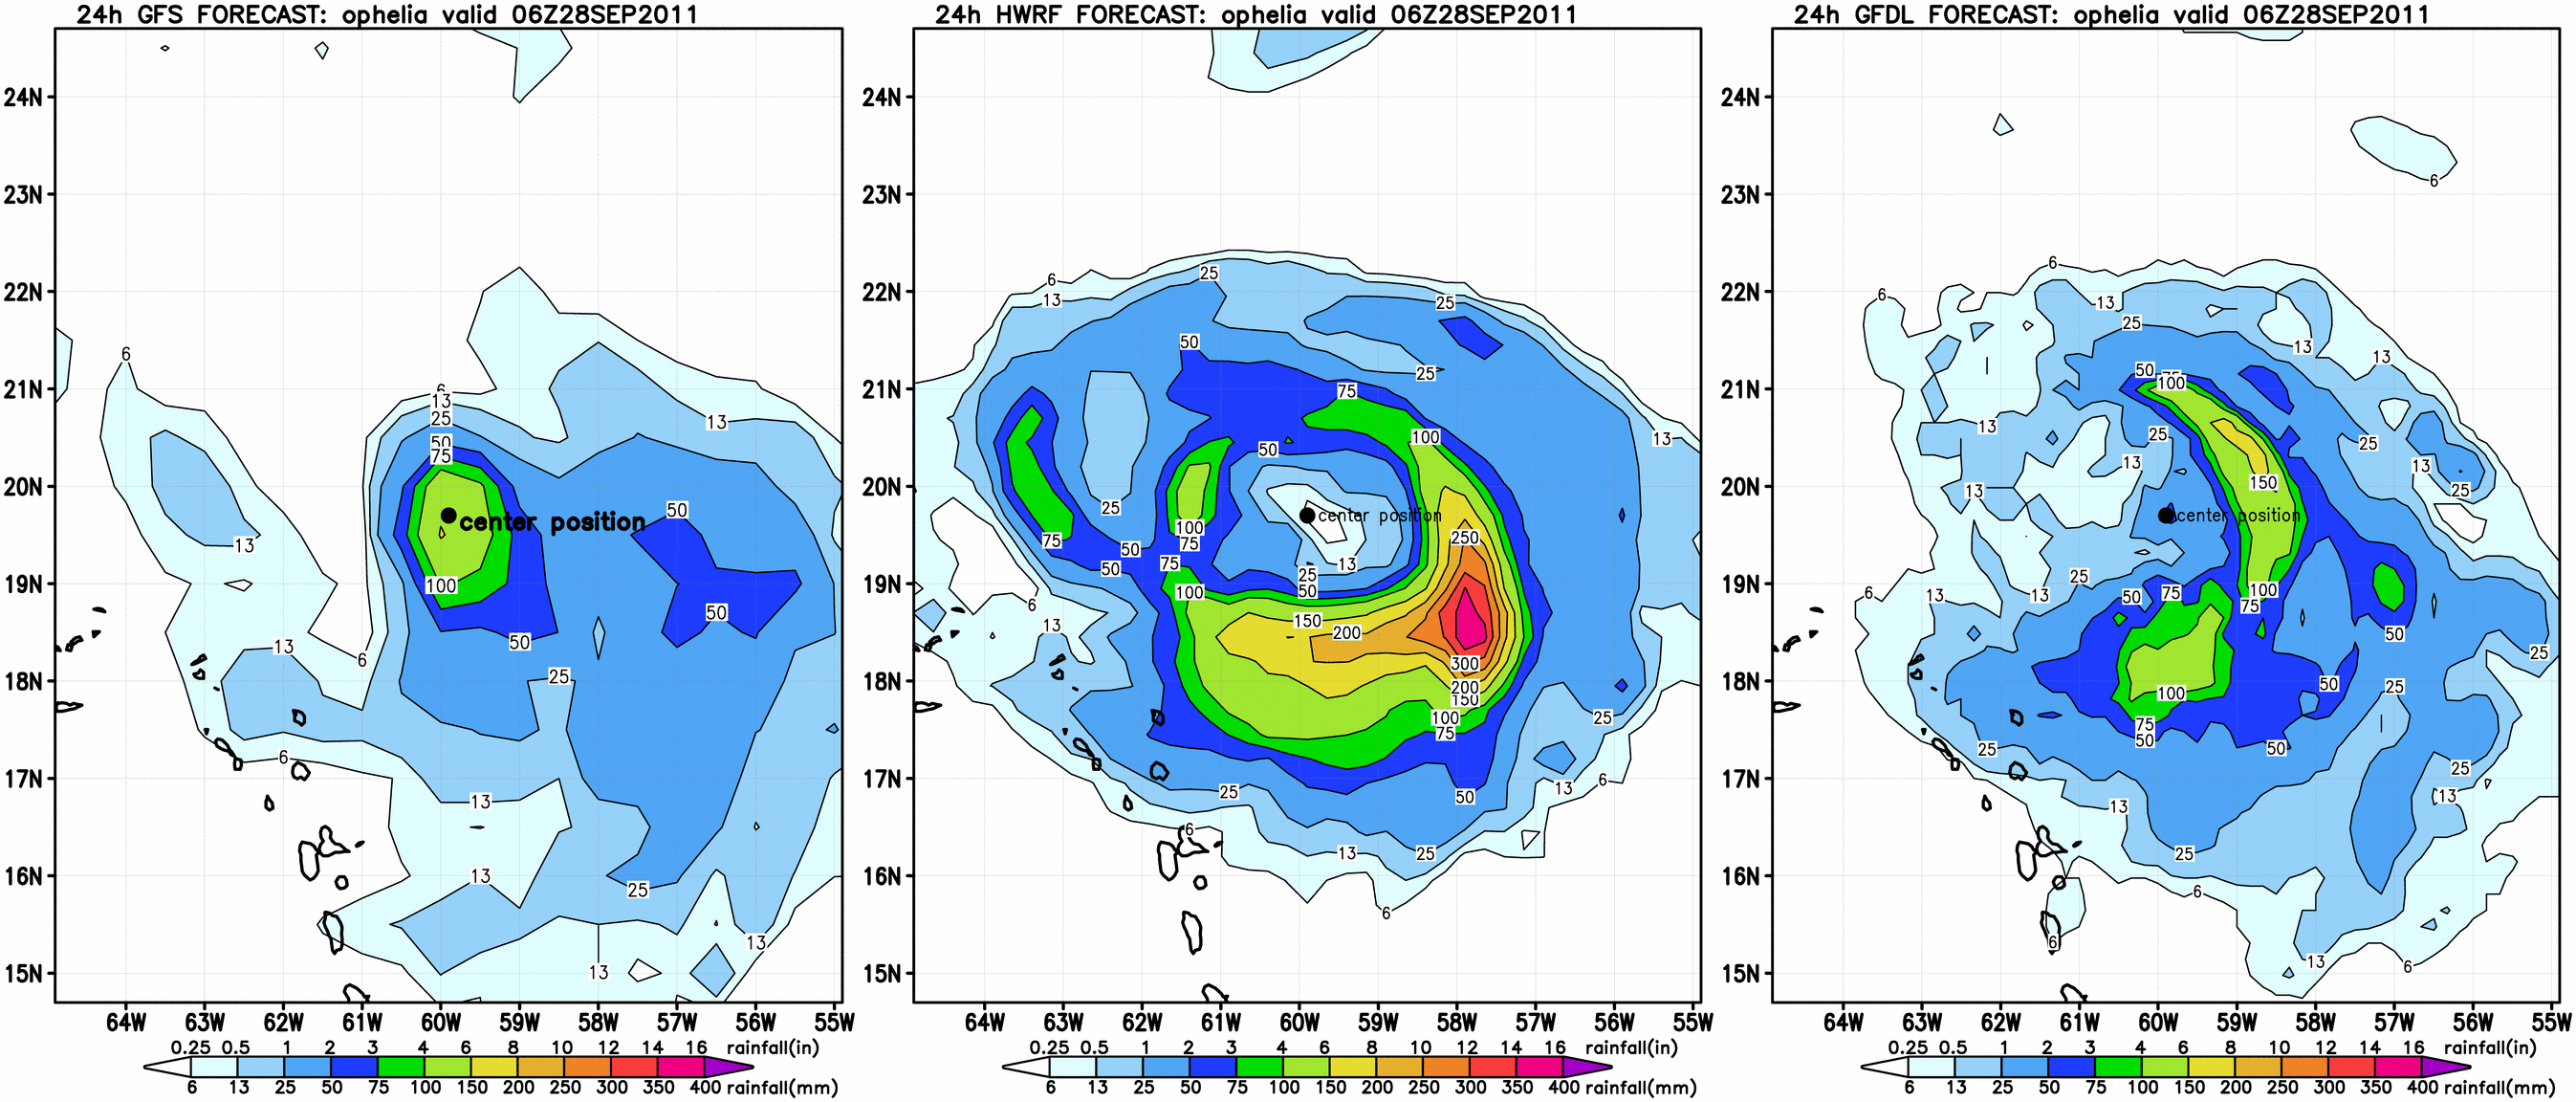
Figure 3. An example of the quantitative precipitation forecasts graphic found on the NHC Experimental Tropical Rainfall Products webpage. Each of the panels in the graphic describes the expected distribution of rainfall over the 24-hr period ending at the date/time noted at the top of the product based on a different forecast method. The first panel in the graphic is a rainfall forecast from a recent run of the GFS forecast model, the middle panel is a forecast from the HWRF model, and the third panel is a forecast from the GFDL model. In the example seen in Figure 3, the graphic is valid at "06Z28SEP2011" and shows the QPFs from each of the three models for the 24-hour period from 0600 UTC 27 September 2011 to 0600 UTC 28 September 2011. The HWRF and GFDL components of this graphic will only be available for tropical cyclones and disturbances that are being monitored for tropical cyclone development. The GFS alone will be available for tropical disturbances that are expected to be heavy rainfall producers over land, but are not expected to become tropical cyclones within the next few days.
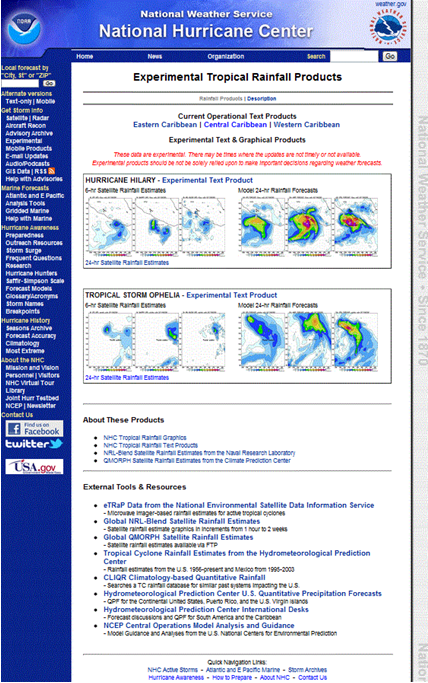
Figure 4. An example of the NHC /TAFB Experimental Satellite QPE and QPF Webpage.
6. Feedback and Comments
The NHC Tropical Analysis and Forecast Branch is requesting your comments and feedback about the NHC /TAFB Experimental Satellite QPE and QPF Webpage. During this period, we encourage your comments or suggestions for improvements and your feedback will help us determine product utility, if modifications are needed, and whether the product should become part of our operational suite.
Please feel free to use either of the methods below for submitting comments.
Short Web Survey: http://www.weather.gov/survey/nws-survey.php?code=srqpf
Email: NHCwebmaster@noaa.gov
Address:
Hugh Cobb, Chief, Tropical Analysis and Forecast Branch
National Hurricane Center
11691 SW 17th Street
Miami, Florida 33165
Feedback Form