


Experimental Wind Speed Probabilities-Based Tropical Cyclone Danger Graphic
Contents
1. Overview
The Tropical Analysis and Forecast Branch (TAFB) is providing on an experimental basis a Tropical Cyclone Danger Area graphic based on the 34-kt wind speed probabilities through 72-hours from the latest tropical cyclone advisory for an active tropical cyclone. The graphic outlines avoidance areas using the 5% and 50% 34-kt wind speed probability contours from the latest tropical cyclone advisory issuance for both the Atlantic and East Pacific basins (Figures 1 and 2). The current Tropical Cyclone Danger Area graphic utilizes the mariner's 1-2-3 rule to outline avoidance areas through 72 hours for active tropical cyclones. Feedback from users indicated that the use of the 1-2-3 methodology has led to "over-warned" large avoidance areas. The 1-2-3 methodology assumes an average forecast track error of 100 nmi at Day 1, 200 nmi at Day 2 and 300 nmi at Day 3 rule (Figure 3). These values are well above the most recent 10-year averaged forecast track errors of 50 nmi at Day 1, 85 nmi at Day 2 and 120 nmi at Day 3.
2. Product Description
The experimental tropical cyclone danger area graphic depicts avoidance areas for mariners out through 72 hours. The avoidance areas are based on the 5% and 50% 34-kt wind speed probability contours from the latest tropical cyclone advisory. The avoidance area encompassed by the 5% 34-kt wind speed probability swath conveys a low to medium risk of experiencing tropical storm force winds within the area and is denoted within a dashed line while the 50% 34-kt wind speed probability swath conveys a high risk of experiencing tropical storm force winds and is denoted within a solid line.
In the event there are no active tropical cyclones in either basin, the graphic will be blank with the following wording THERE IS NO TROPICAL CYCLONE ACTIVITY IN THE ATLANTIC for the Atlantic charts and THERE IS NO TROPICAL CYCLONE ACTIVITY IN THE EAST PACIFIC for the East pacific charts.
In the event there is a medium chance or greater ( > 40%) of tropical cyclogenesis in the Graphical Tropical Weather Outlook, an area of possible tropical cyclogenesis will be depicted by the forecaster in the experimental tropical cyclone danger graphic. This is currently done for the operational tropical cyclone danger graphic.
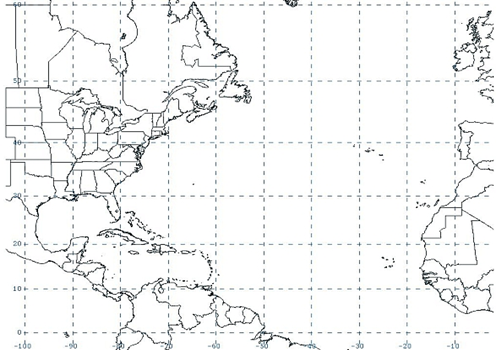 Figure 1. Bounds of the experimental tropical cyclone graphic for the Atlantic basin.
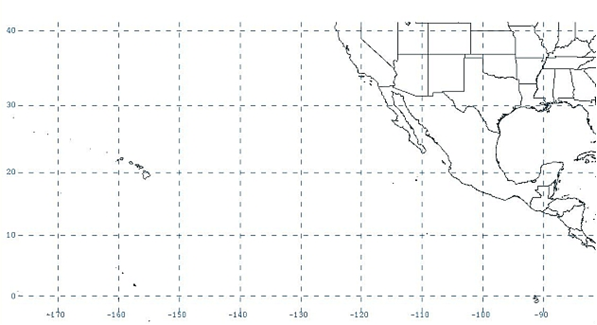 Figure 2. Bounds of the experimental tropical cyclone graphic for the East Pacific basin.
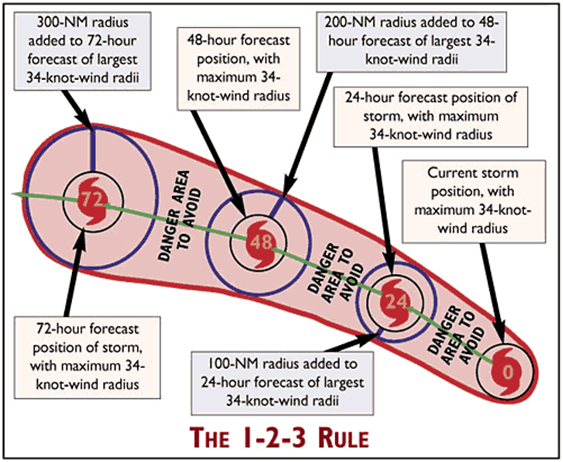 Figure 3. Illustration of the Mariner-s 1-2-3 rule.
3. Methodology
The calculation of the wind speed probabilities is accomplished by creating a large set of alternative but plausible tracks and intensities roughly centered on the current official forecast. These alternate forecasts are determined by random sampling of historical track and intensity errors in official NHC forecasts over the past 5 years. The alternate intensity forecasts consider whether each alternate track is over land or water, and the alternate intensity forecasts are adjusted accordingly. The size of the tropical cyclone (set of wind radii) for each alternate track is determined by a wind radii climatology and persistence (CLIPER) model and its error components. The CLIPER model takes into account the size of the cyclone at that start of the forecast period as well as typical changes in size that occur as a cyclone experiences changes in strength, forward motion, and other factors. An adjustment is made, for purposes of calculating the probabilities, so that the wind radii represent the average, rather than the maximum, extent of winds in each quadrant. This process results in probabilities of actually experiencing certain wind speeds, not probabilities of falling within the traditional forecast wind radii that indicate the maximum extent of winds from the center. Swaths of particular wind speeds are then computed for each alternate forecast. Probabilities are computed on a 0.5x0.5 degree latitude-longitude grid by counting the fraction of alternate forecasts in which each point falls within a given wind swath (34, 50, or 64 kt). This output is then processed and expressed in text or graphical format via the products being produced by the NHC.
4. Availability
The experimental tropical cyclone danger area graphics are available four times daily at 0400 1000, 1600 and 2200 UTC on the National Hurricane Center web site at the following URL:
http://www.nhc.noaa.gov/marine
5. Examples
Below are some images comparing the swath of the danger area of 34-kt winds based on the Mariners 1-2-3 rule in the operational version of the tropical cyclone danger area graphic and the 5% 34-kt wind speed probability swath in the experimental version of the tropical cyclone danger area graphic.
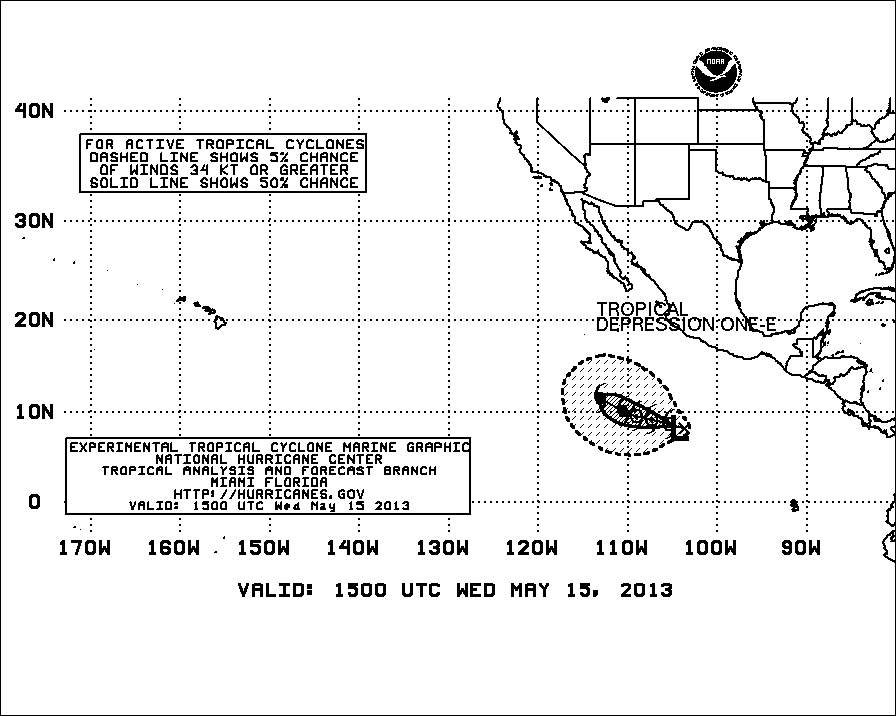 Figure 4. Comparison of the swath of the danger area of 34-kt winds based on the Mariner's 1-2-3 rule in the operational version of the tropical cyclone danger area graphic (left) and the 10% 34-kt wind speed probability swath in the experimental version (right) for Tropical Storm Alberto for the 2100 UTC 20 May 2012 advisory.
6. Feedback and Comments
The Tropical Analysis and Forecast Branch is requesting your comments and feedback about these experimental probabilities-based Tropical Cyclone Danger Graphics. During this period, we encourage your comments or suggestions for improvements and your feedback will help us determine product utility, if modifications are needed, and whether the product should become part of our operational suite.
Please feel free to use any of the methods below for submitting comments.
Short Web Survey: www.nws.noaa.gov/survey/nws-survey.php?code=TCDWBP
Email: NHCwebmaster@noaa.gov
Address:
Hugh Cobb, Chief
Tropical Analysis and Forecast Branch
National Hurricane Center
11691 SW 17th Street
Miami, Florida 33165
Feedback Form