Skip Navigation Links
NOAA NOAA United States Department of Commerce

NHC Graphical Outlook Archive


« Earliest Available         ‹ Earlier         Later ›         Latest Available »
GIS Shapefiles
Central Pacific Eastern Pacific Atlantic

View 2-Day Graphical Tropical Weather Outlook
Click for Eastern North Pacific Click for Eastern North Pacific

Tropical Weather Outlook Text

ZCZC HFOTWOCP ALL
TTAA00 PHFO DDHHMM

Tropical Weather Outlook
NWS Central Pacific Hurricane Center Honolulu HI
200 PM HST Fri Sep 1 2023

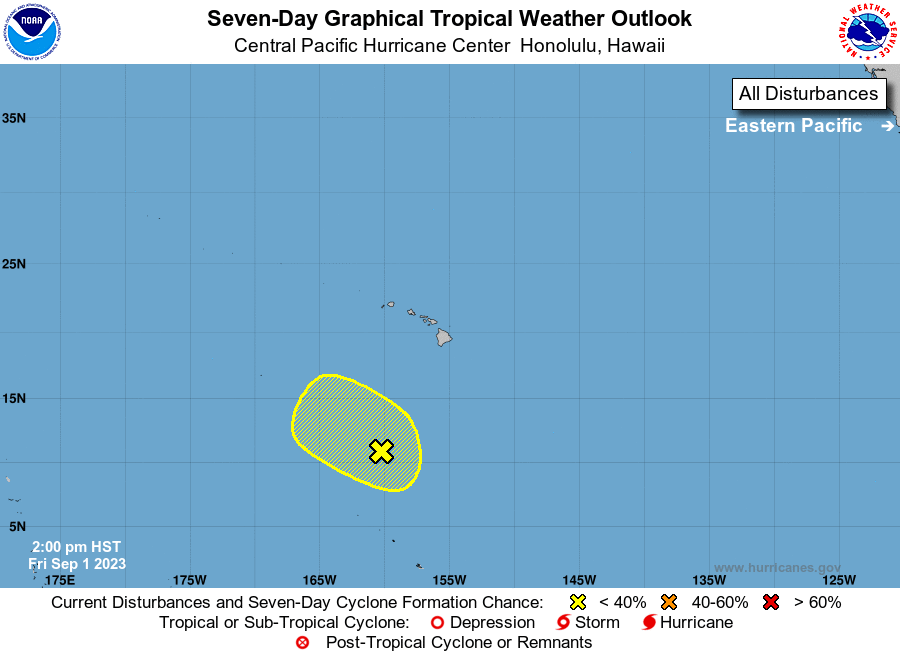
For the central North Pacific...between 140W and 180W:

1. Approximately 750 miles south of Honolulu, Hawaii: 
A weak area of low pressure located far south of Honolulu, Hawaii 
is producing disorganized showers and thunderstorms. 
As this area moves northwestward, there is a short window for 
possible development over the next day or so before upper level 
conditions become unfavorable. 
* Formation chance through 48 hours...low...10 percent. 
* Formation chance through 7 days...low...10 percent.

Forecaster Kodama


List of Atlantic Outlooks (May 2023 - Present)
List of East Pacific Outlooks (May 2023 - Present)
List of Central Pacific Outlooks (May 2023 - Present)
List of Atlantic Outlooks (July 2014 - April 2023)
List of East Pacific Outlooks (July 2014 - April 2023)
List of Central Pacific Outlooks (June 2019 - April 2023)
List of Atlantic Outlooks (June 2009 - June 2014)
List of East Pacific Outlooks (June 2009 - June 2014)