


The Inland Wind Model and the Maximum Envelope Of Winds
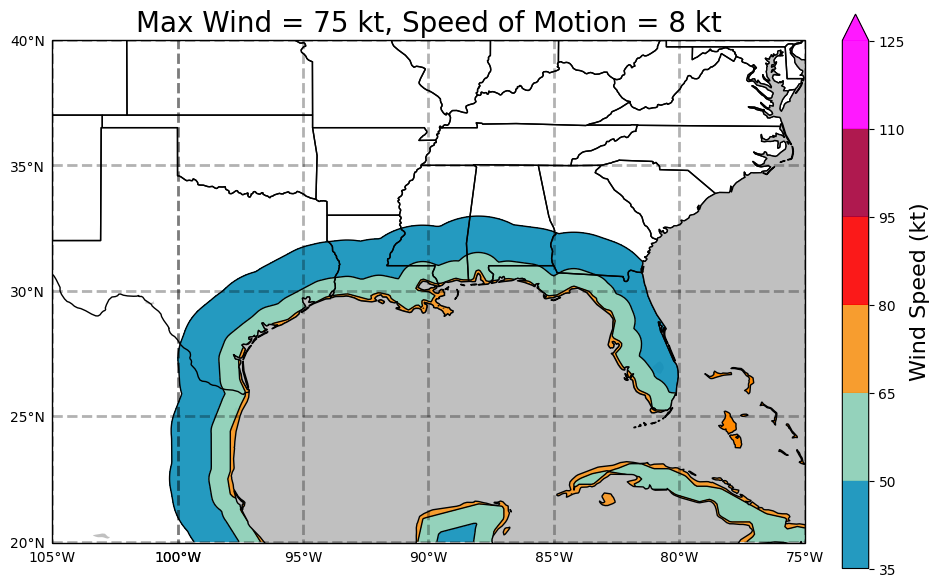
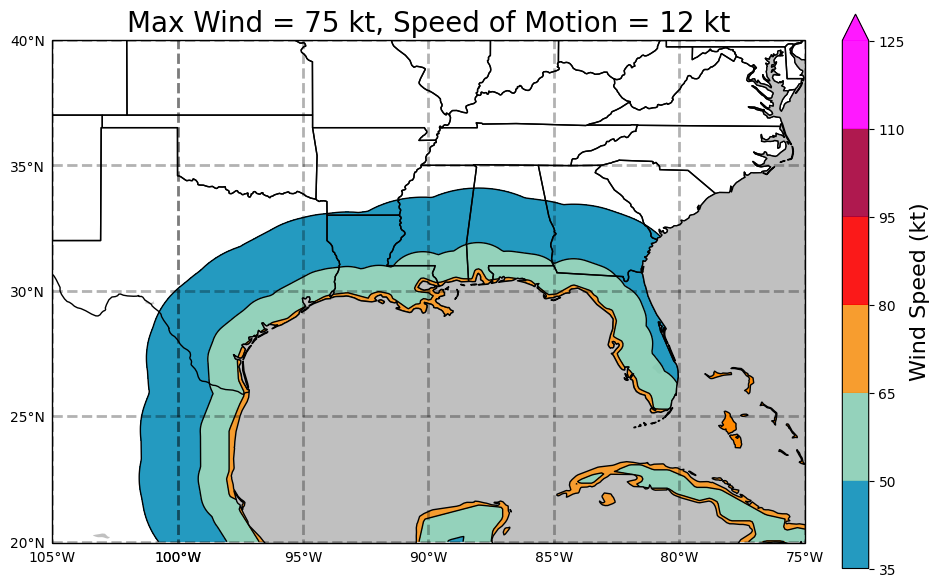
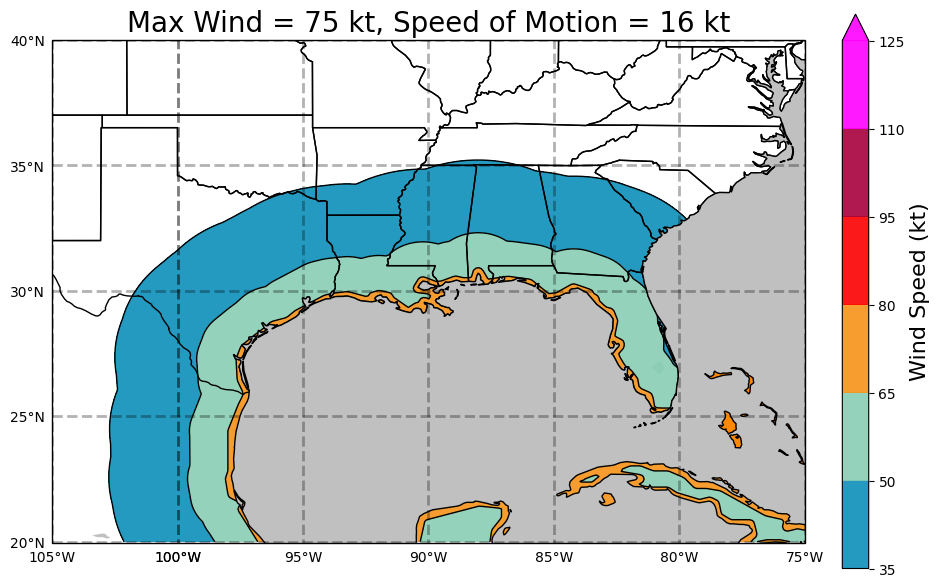
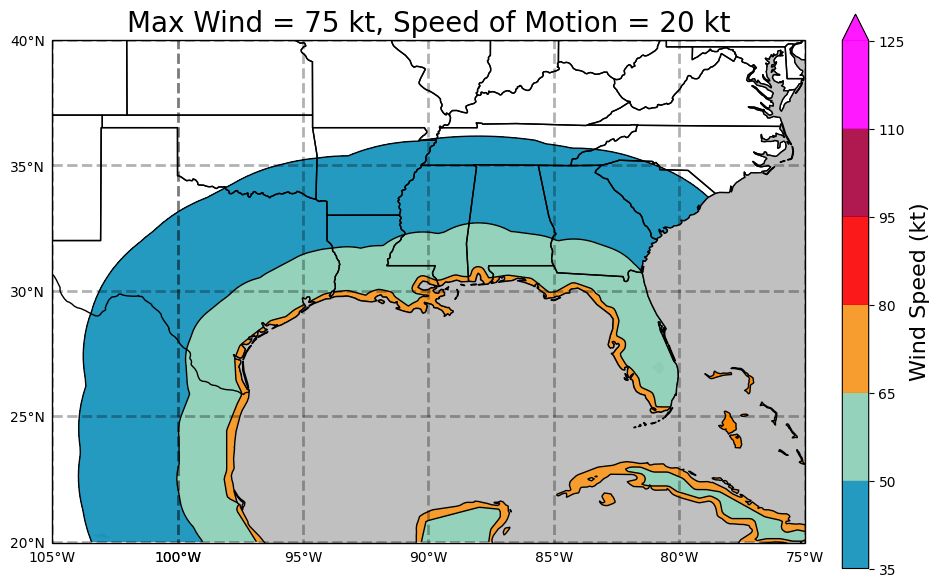
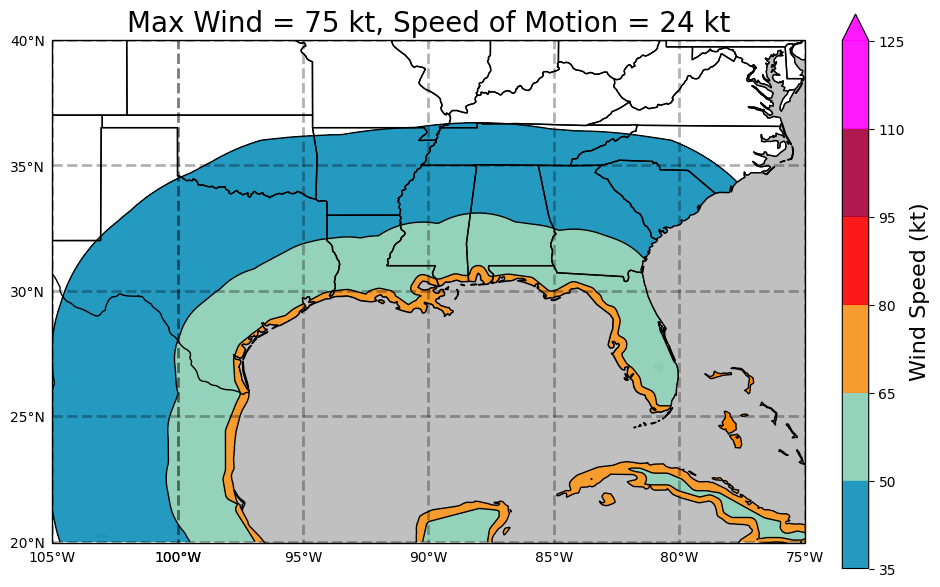
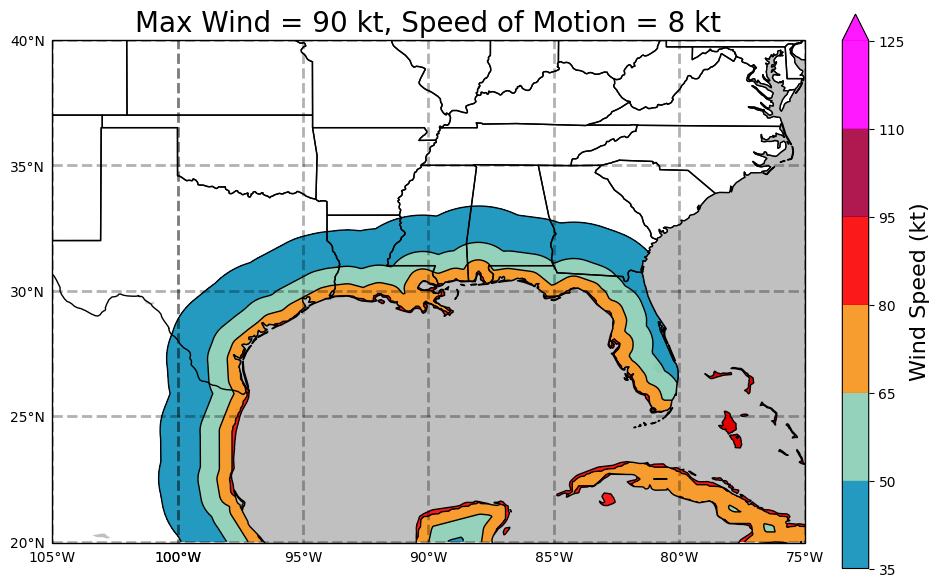
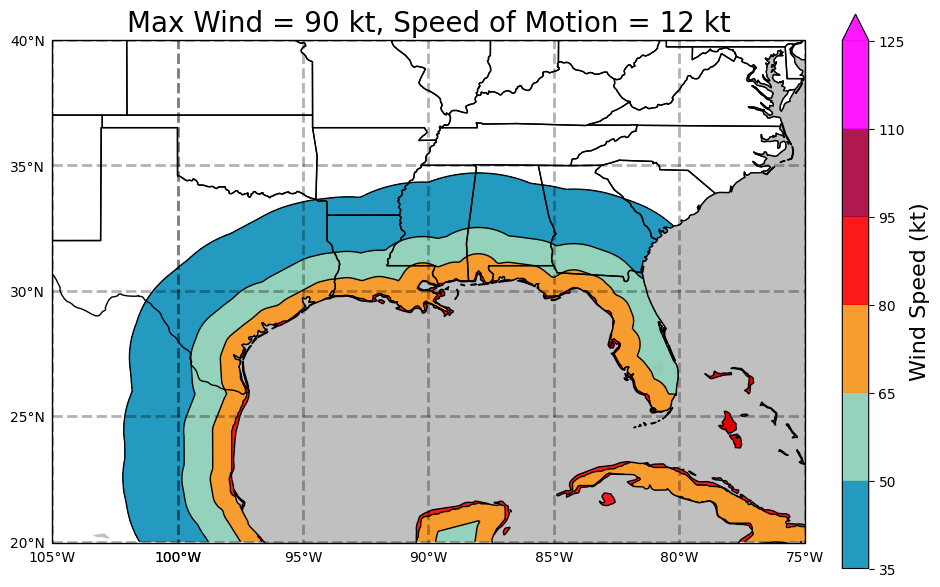
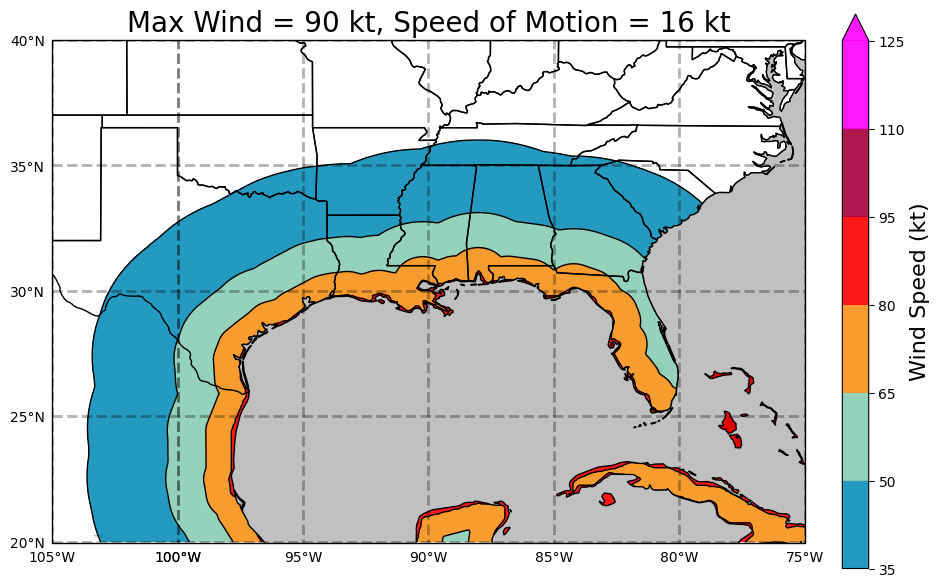
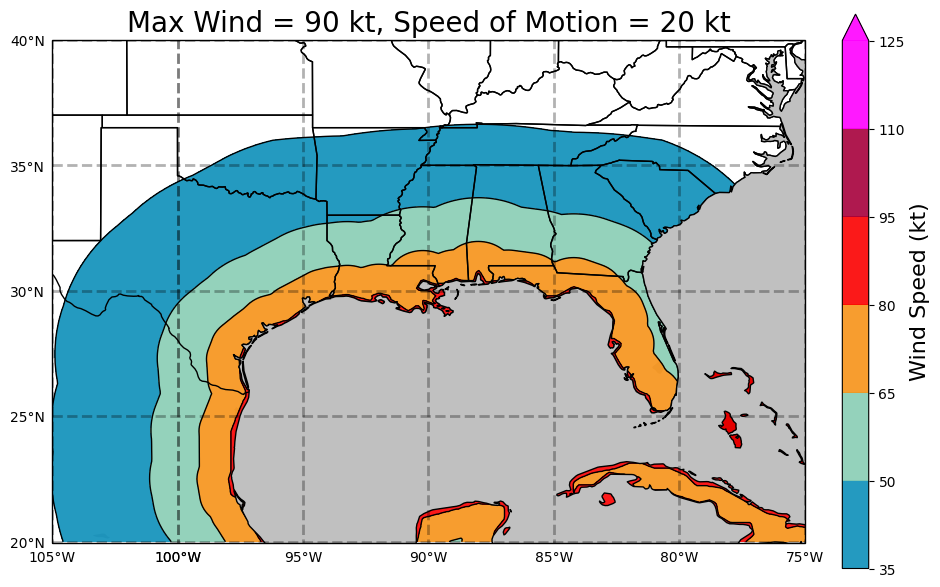
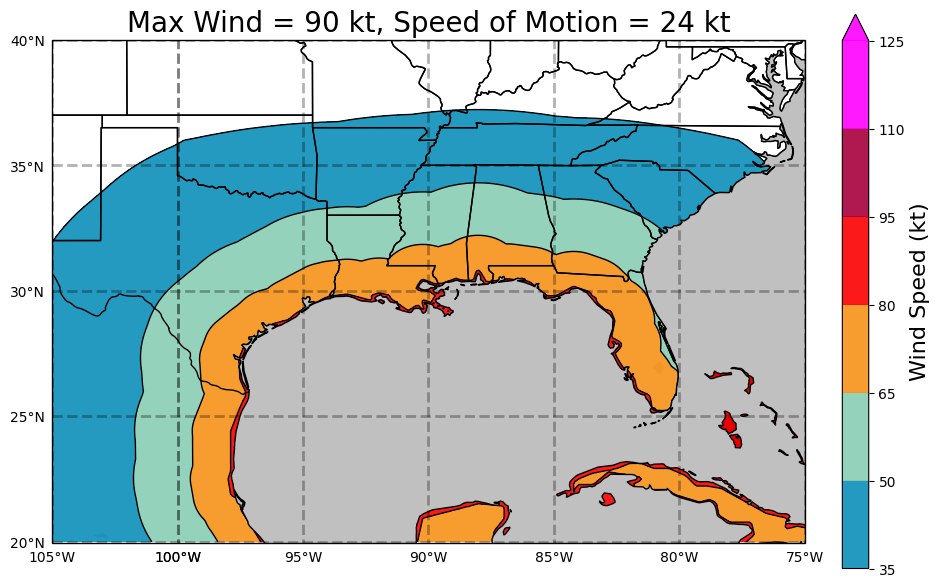
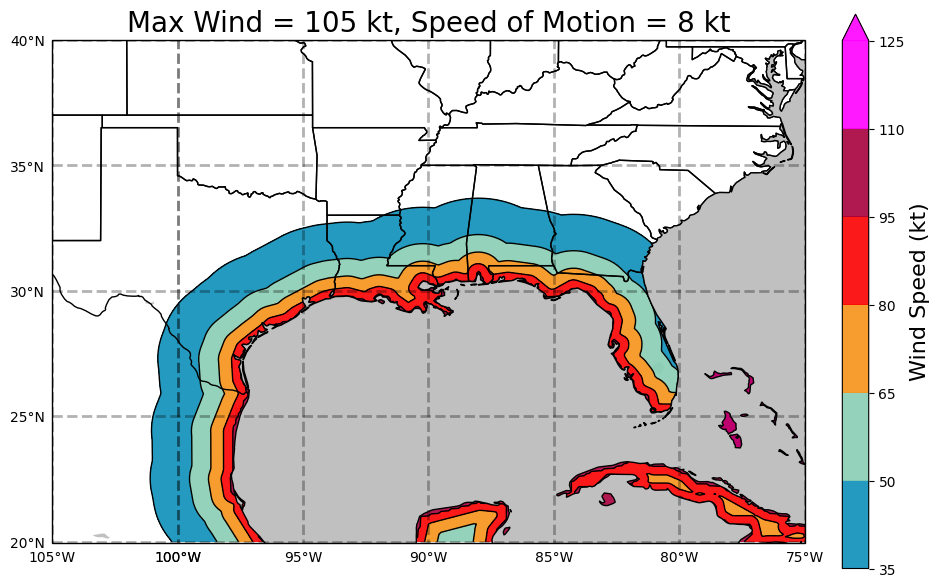
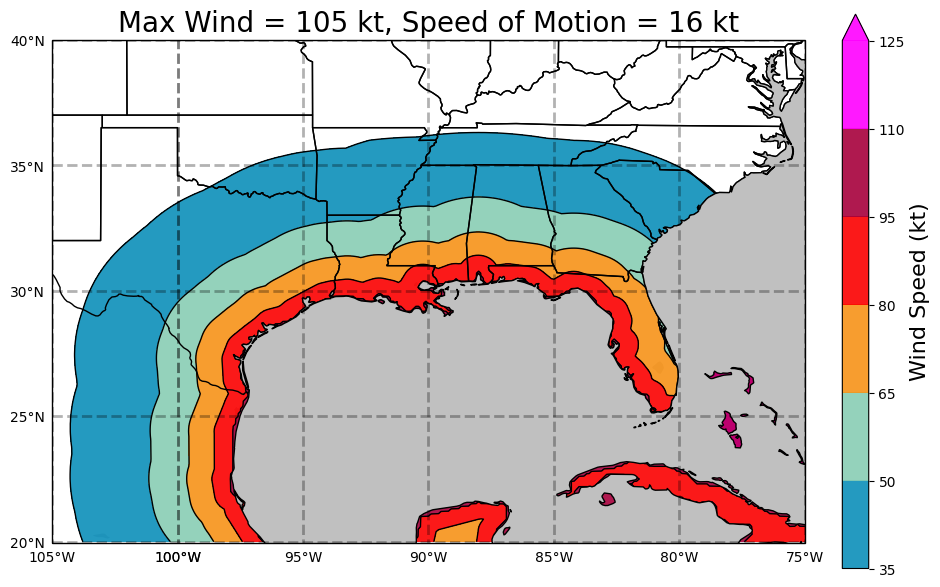
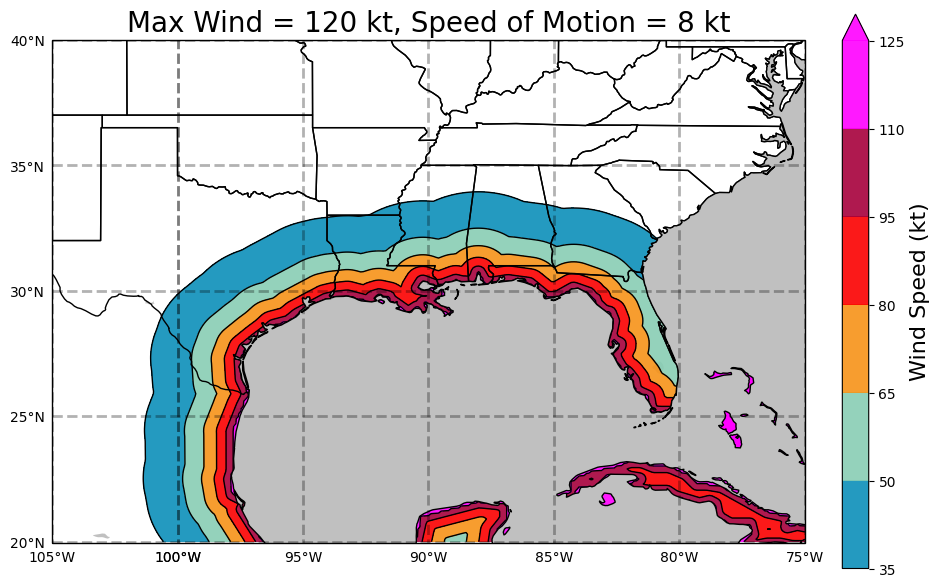
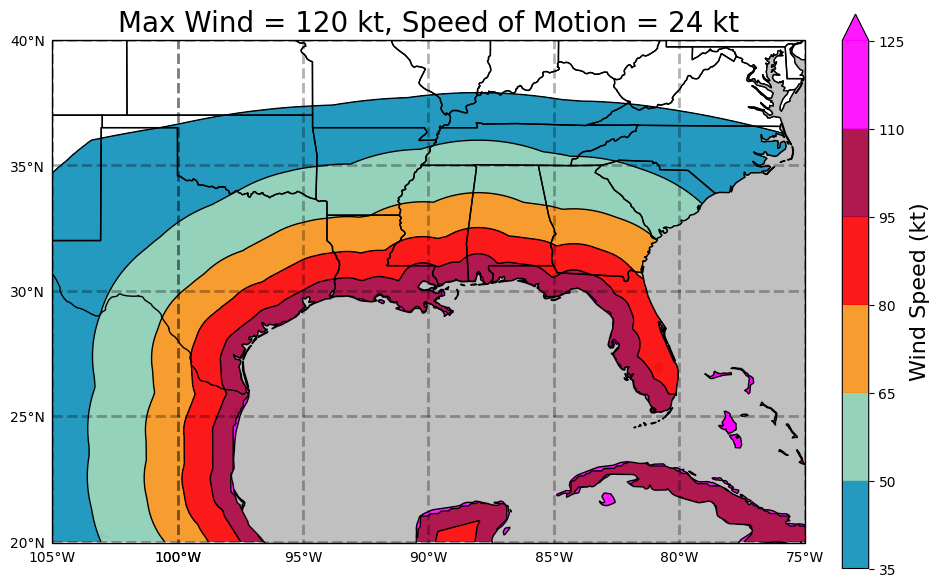
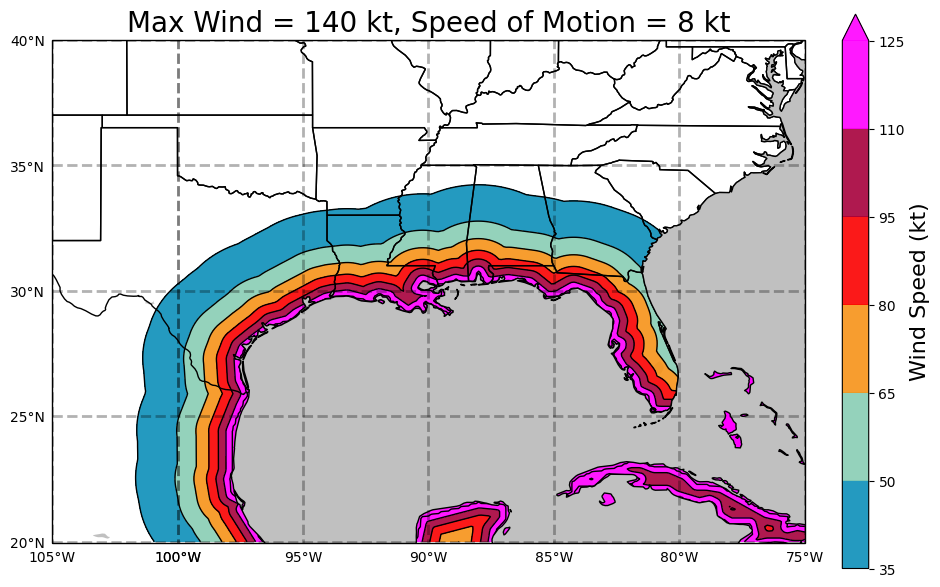
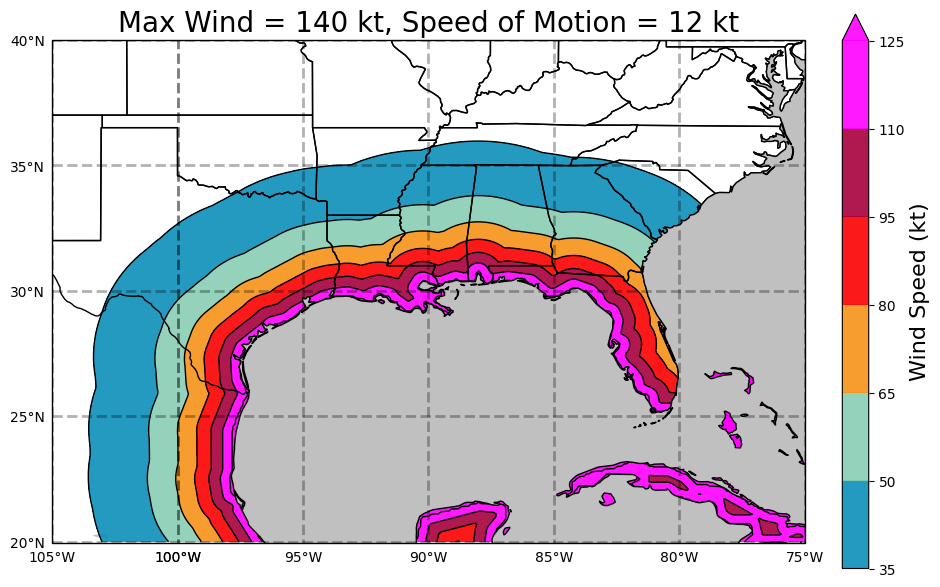
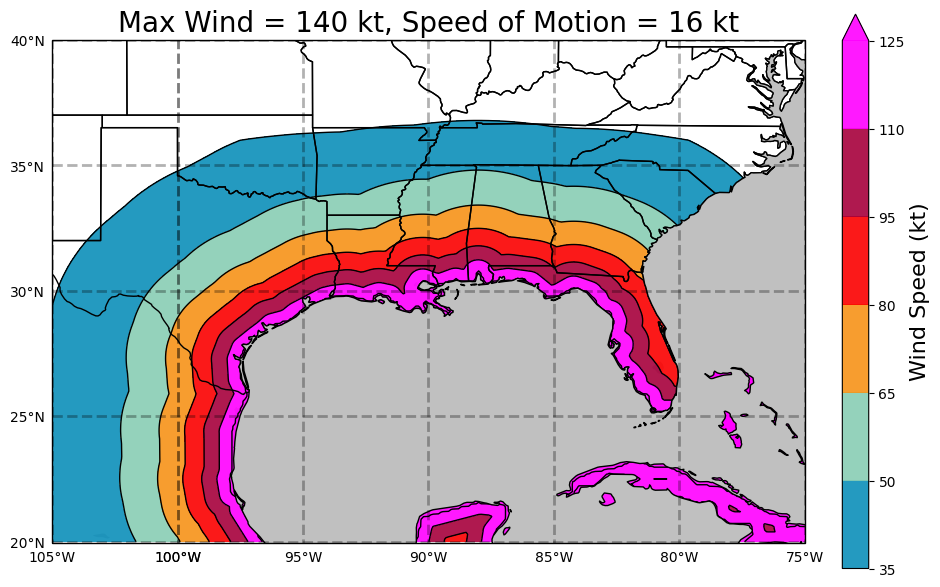
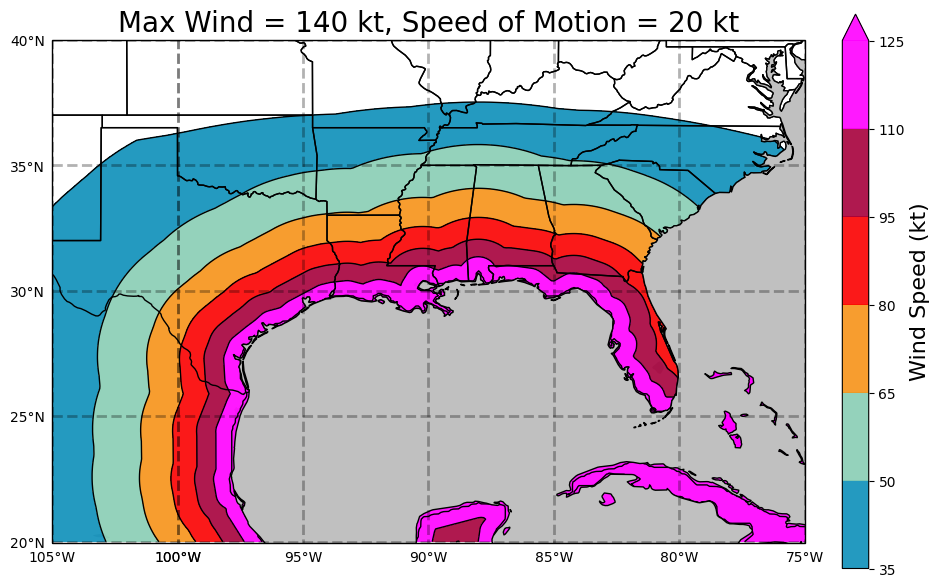
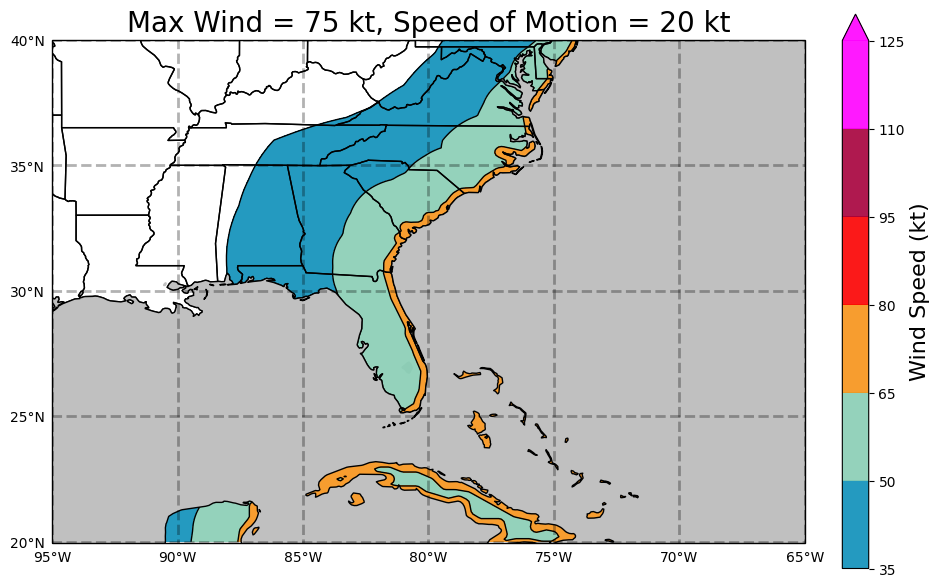
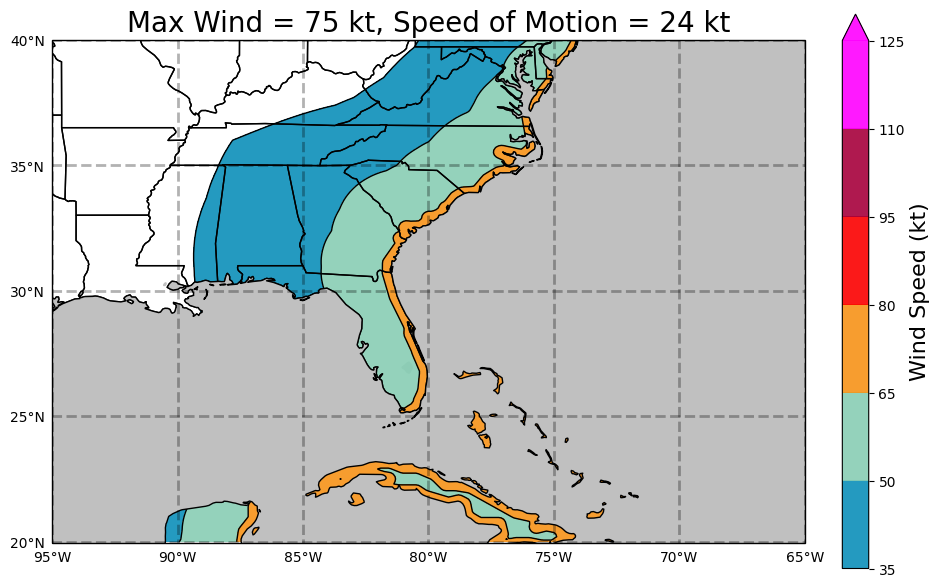
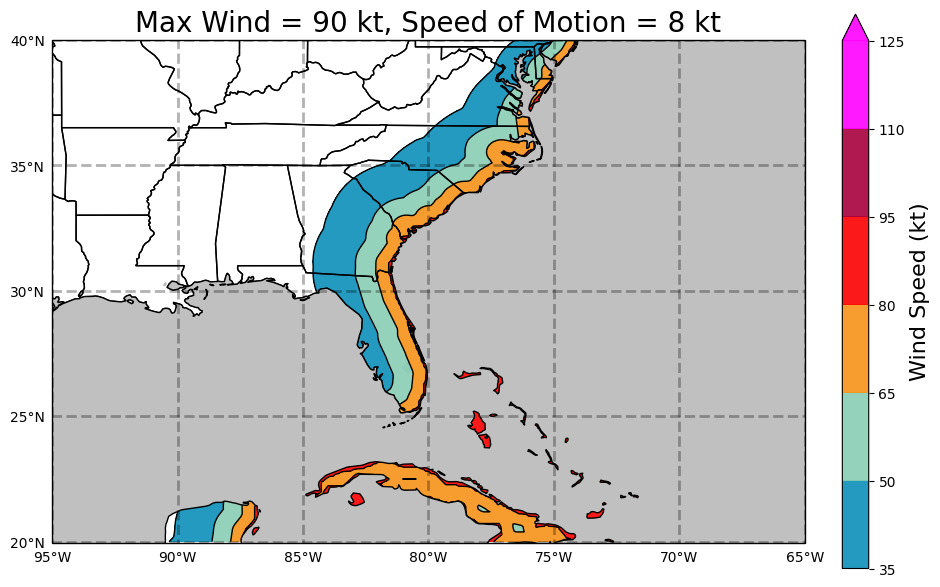
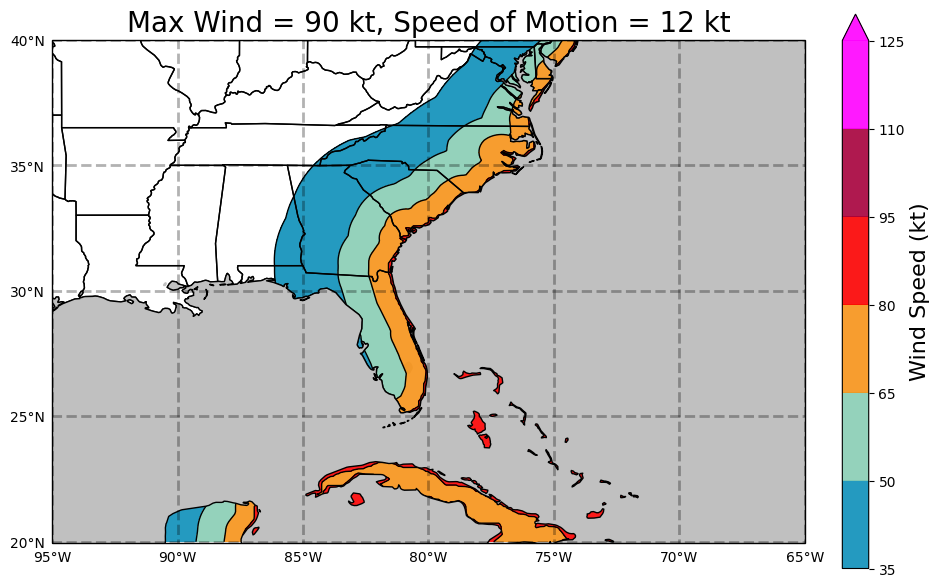
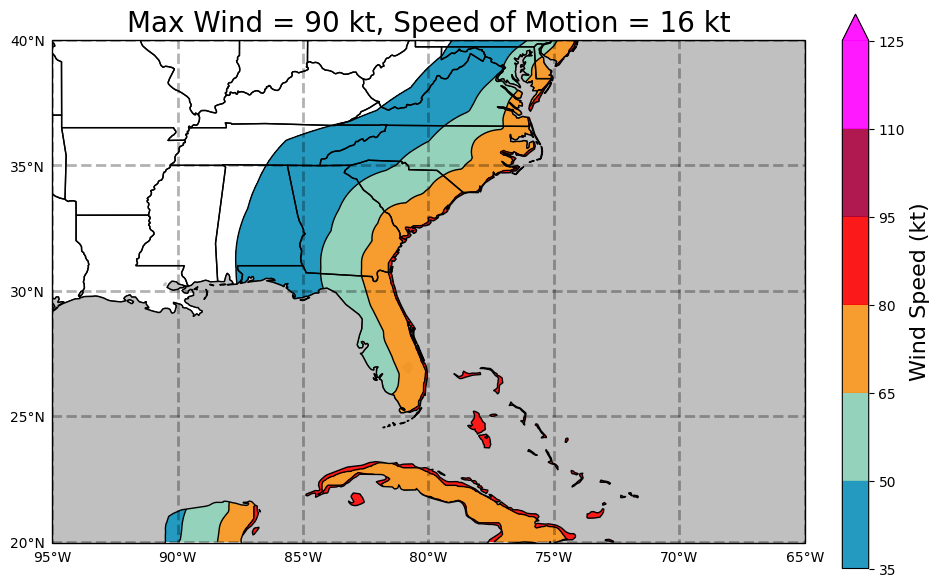
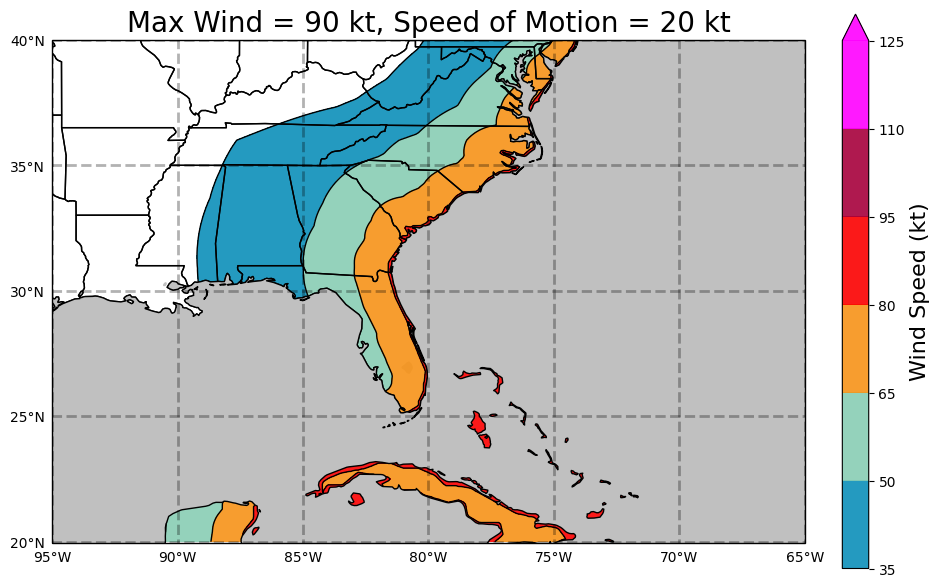
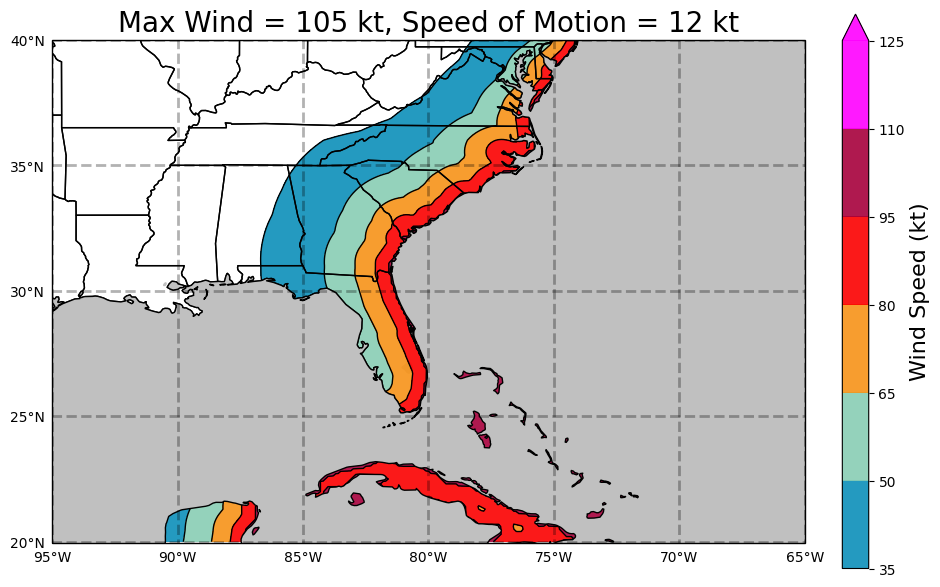
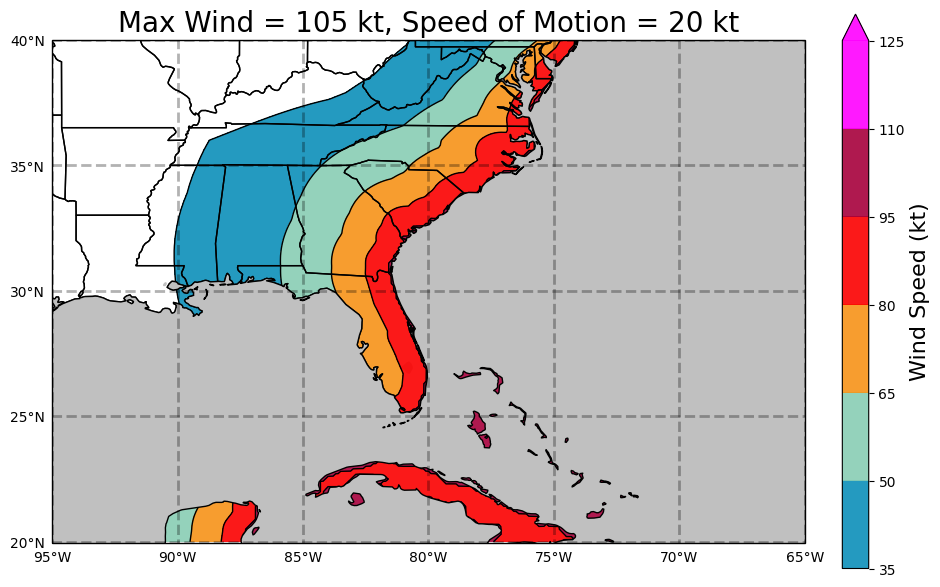
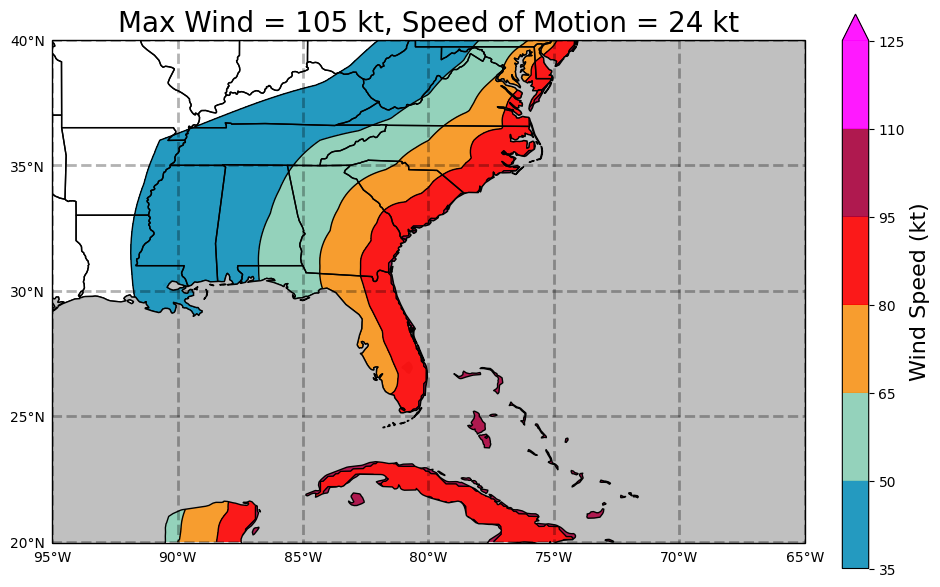
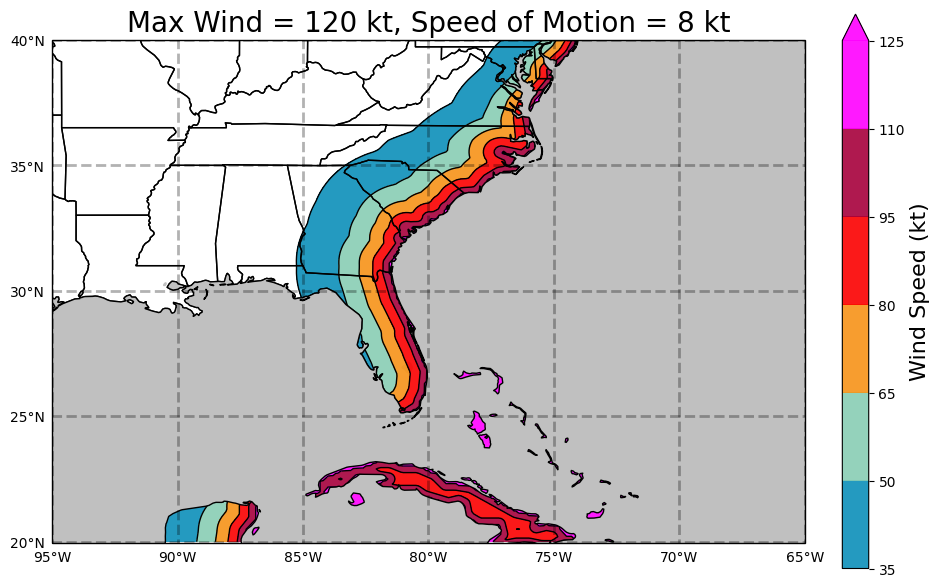
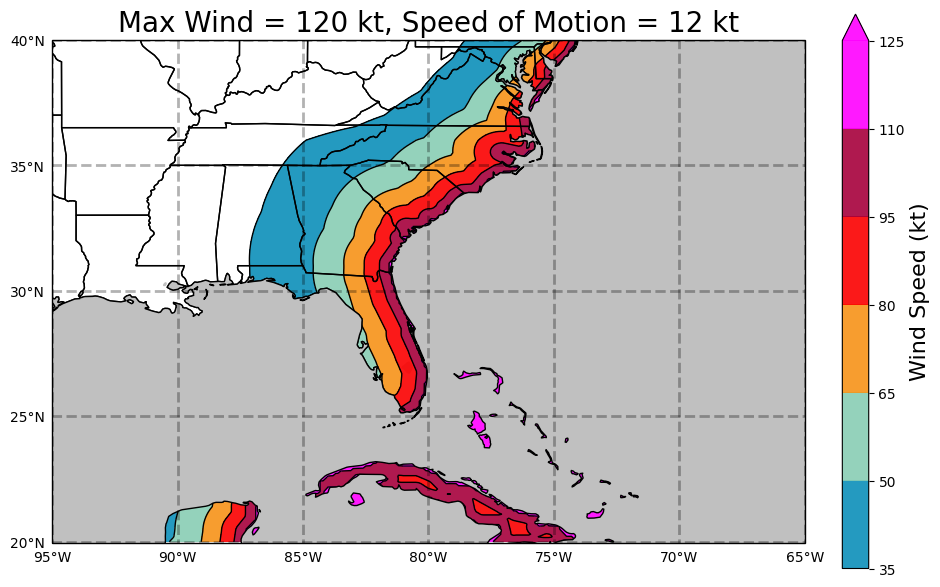
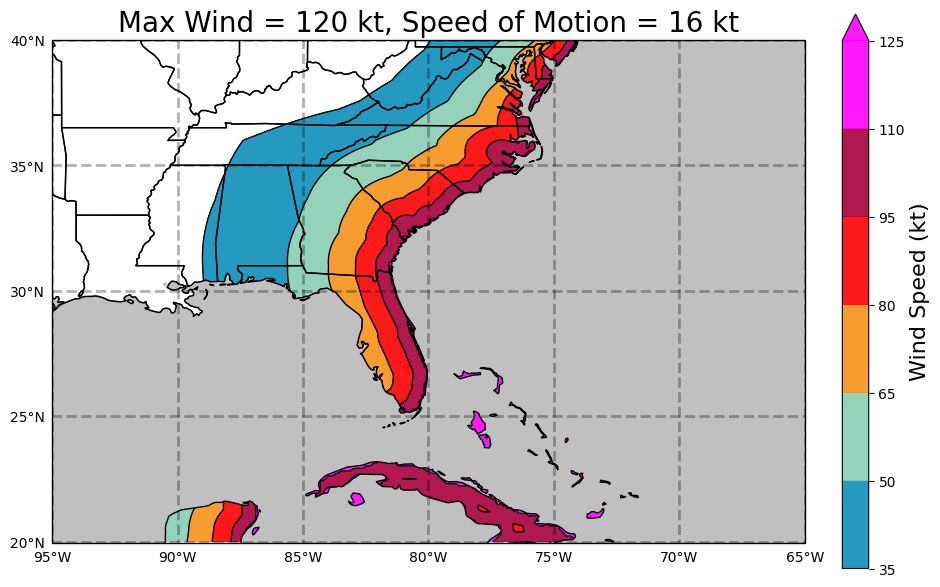
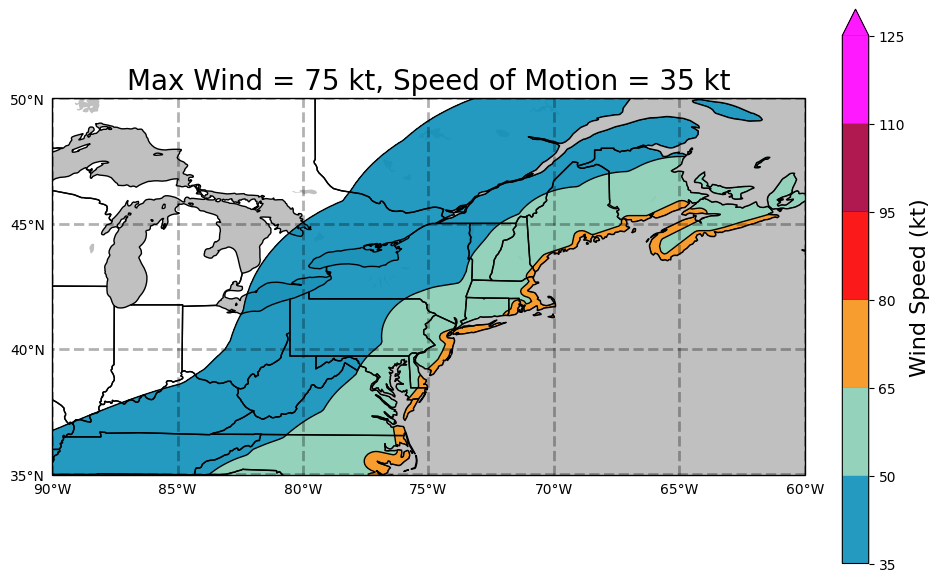
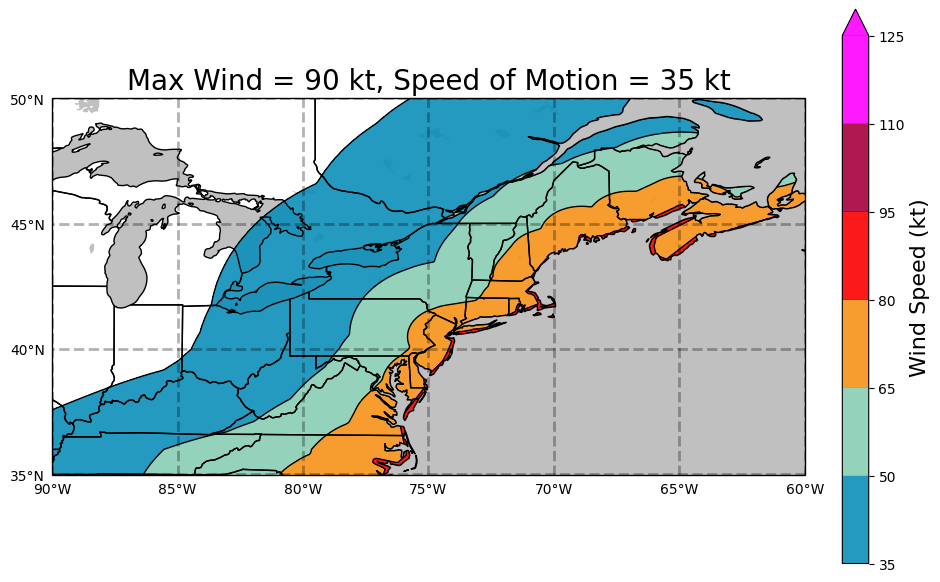
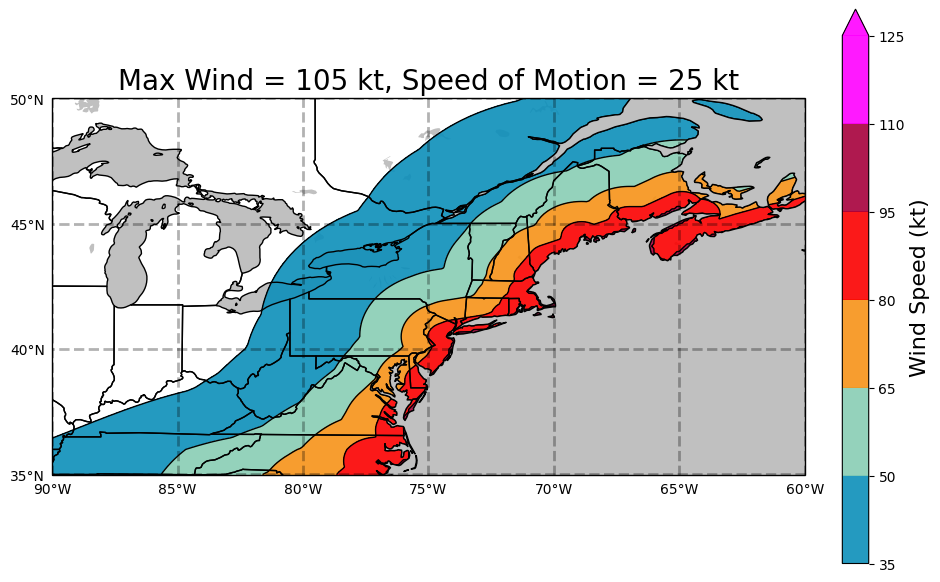
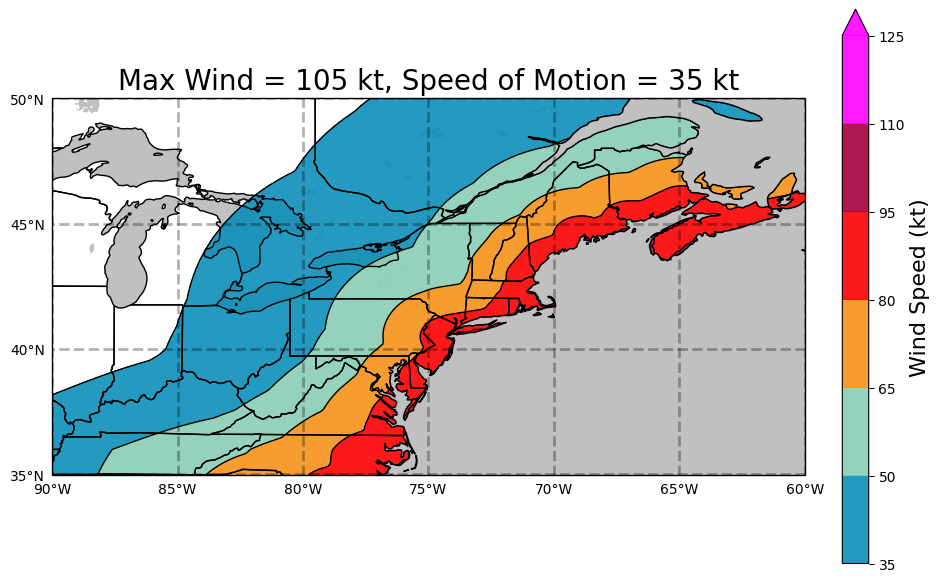
The inland wind model was developed by Mark DeMaria (NOAA/NWS/TPC) and John Kaplan (NOAA/AOML/HRD). The model applies a simple two parameter decay equation to the hurricane wind field at landfall to estimate the maximum sustained surface wind as a storm moves inland. This model can be used for operational forecasting of the maximum winds of landfalling tropical cyclones. It can also be used to estimate the maximum inland penetration of hurricane force winds (or any wind threshold) for a given initial storm intensity and forward storm motion. For further explanation refer to:
Kaplan, J., DeMaria, M., 1995: A Simple Empirical Model for Predicting the Decay of Tropical Cyclone Winds After Landfall. J. App. Meteor., 34, No. 11, 2499-2512.
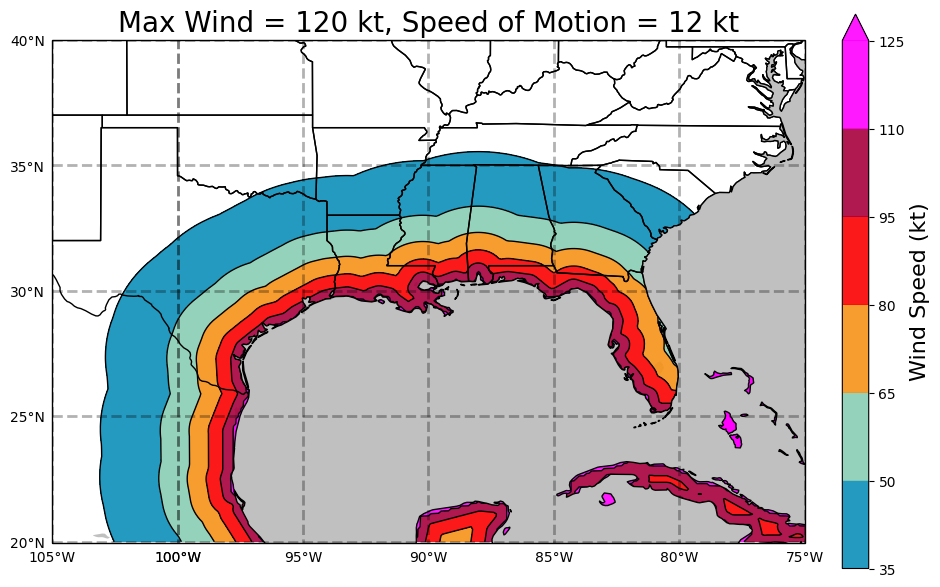
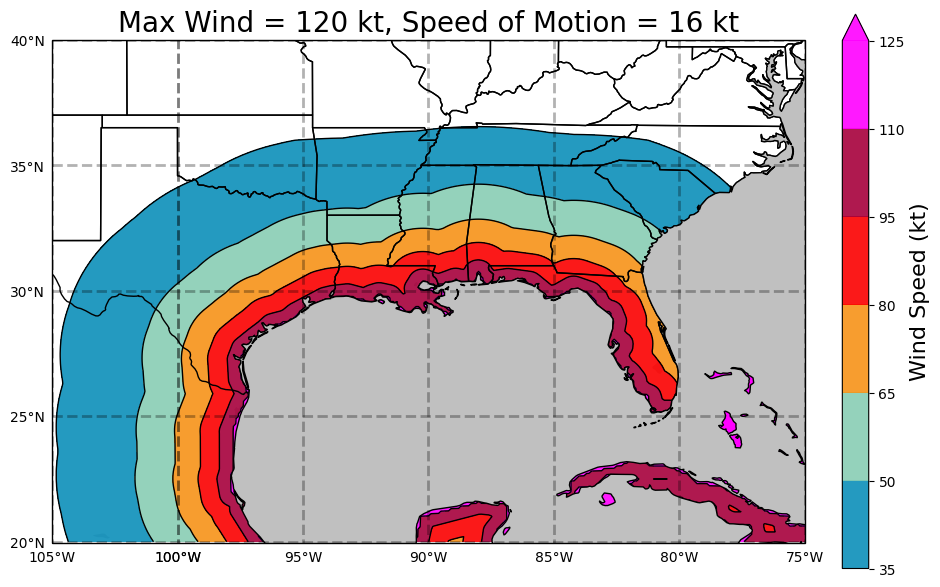
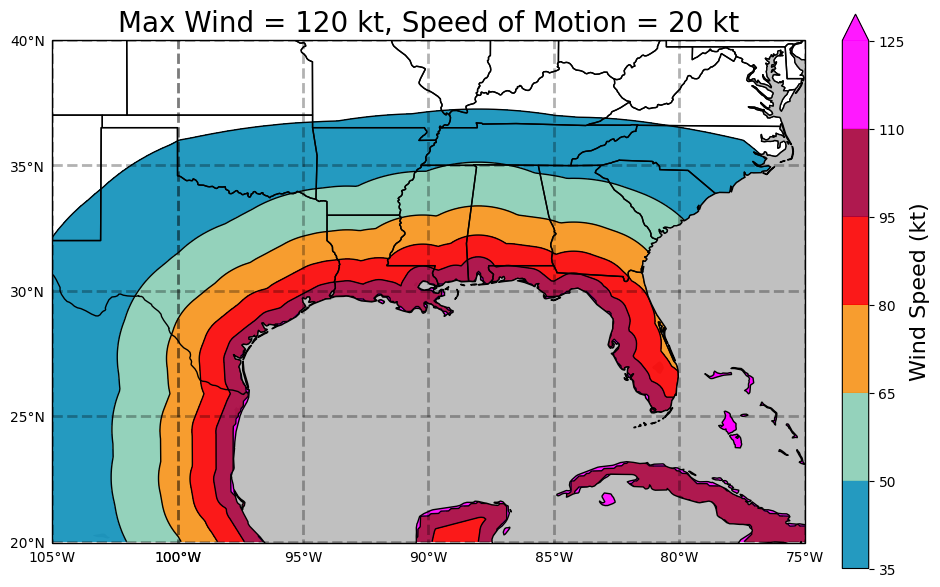
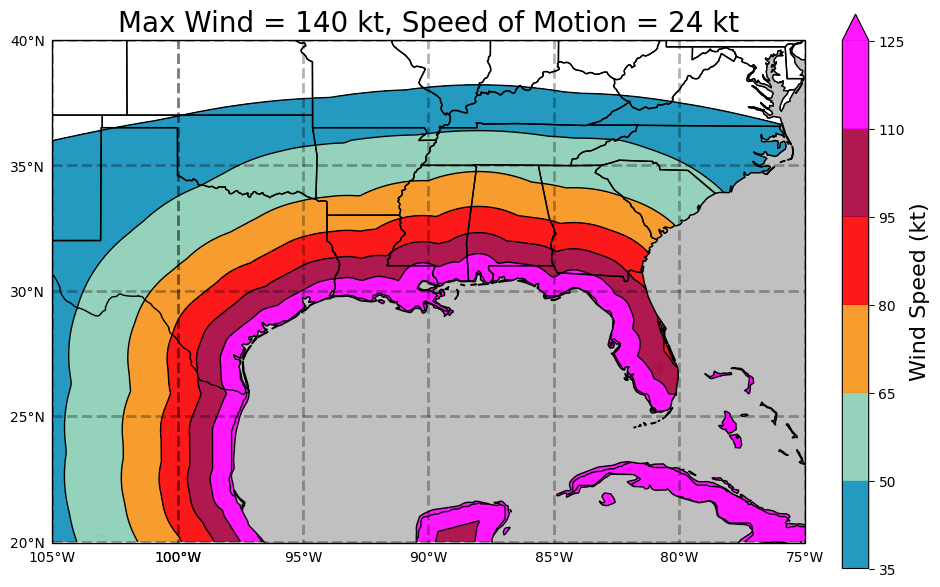
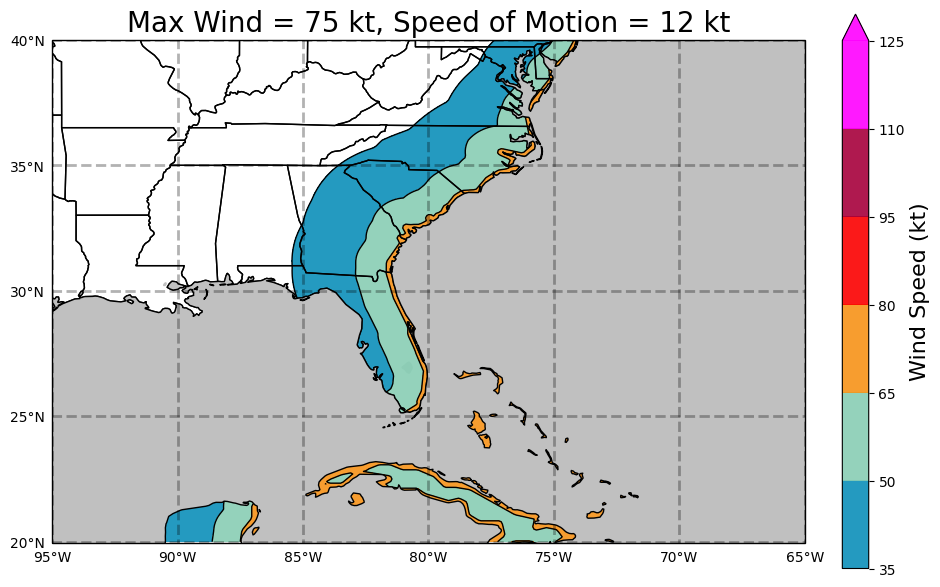
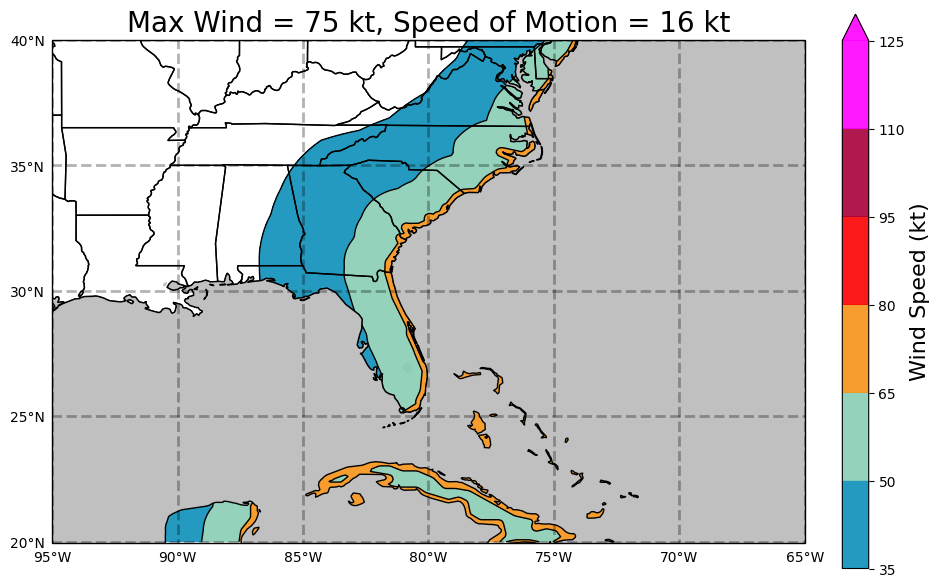
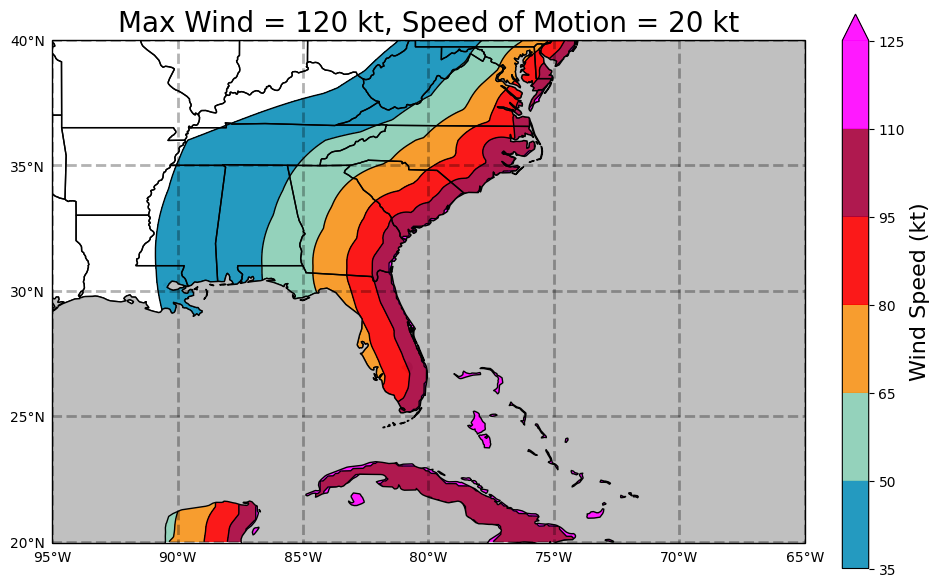
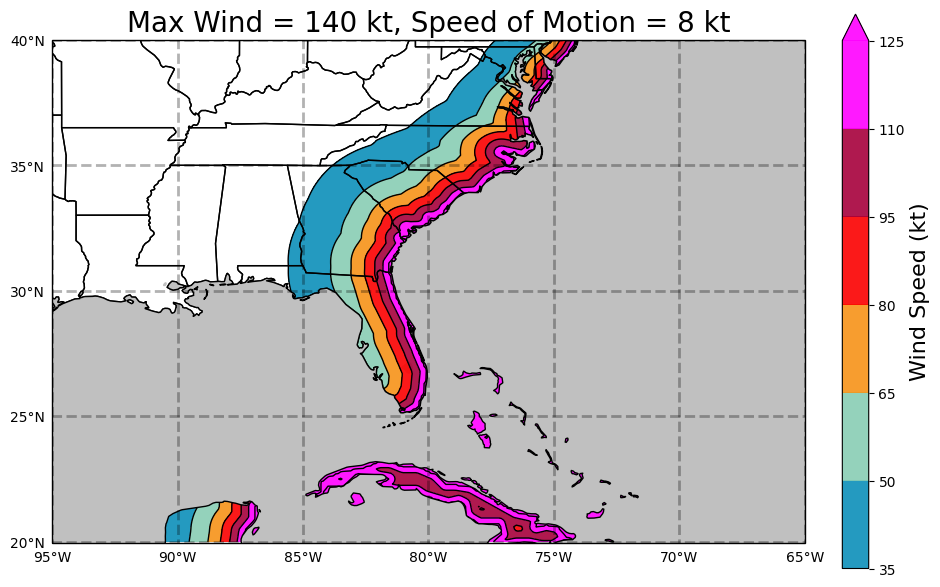
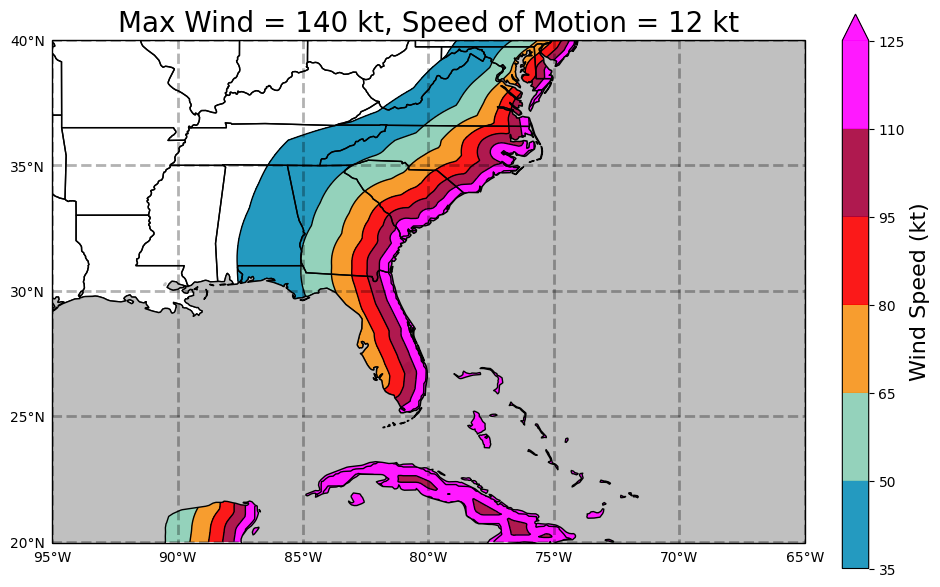
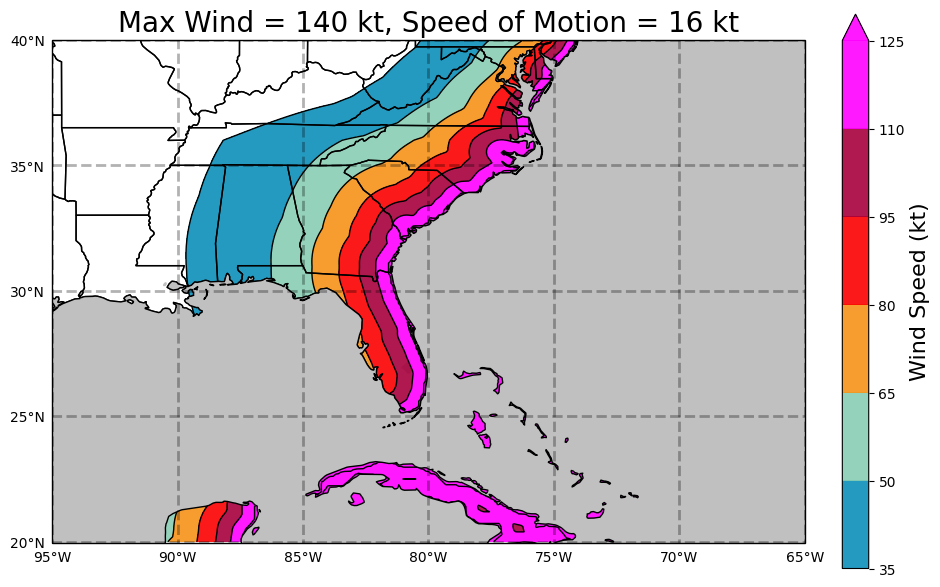
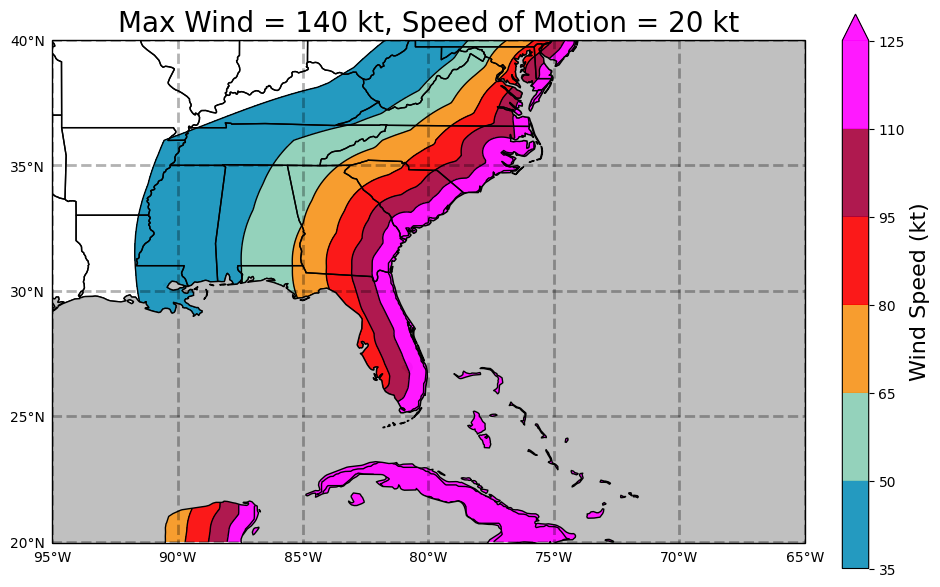
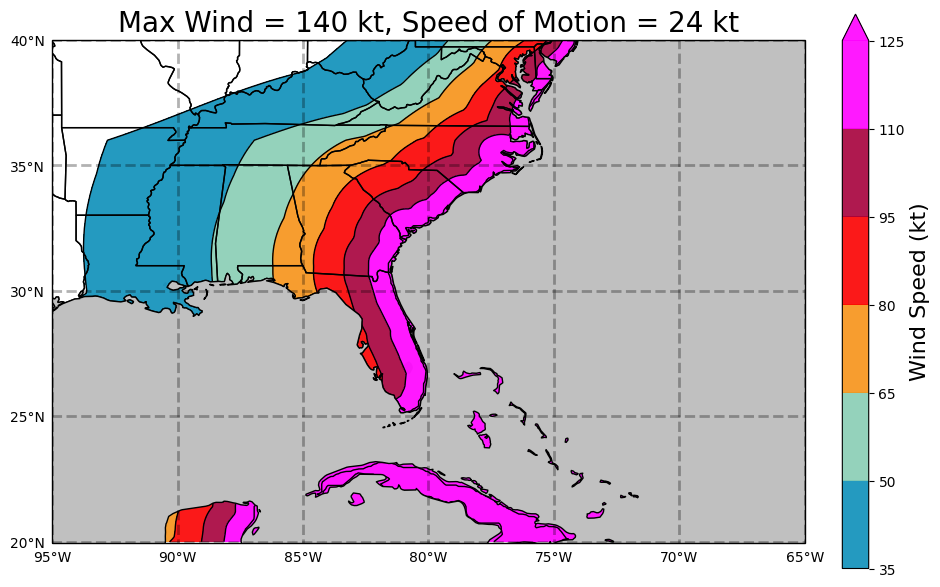
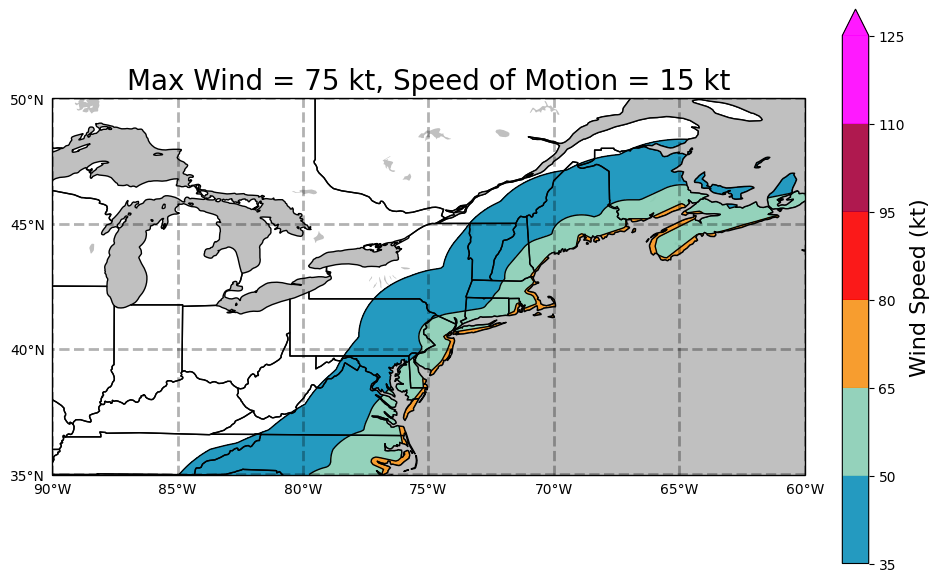
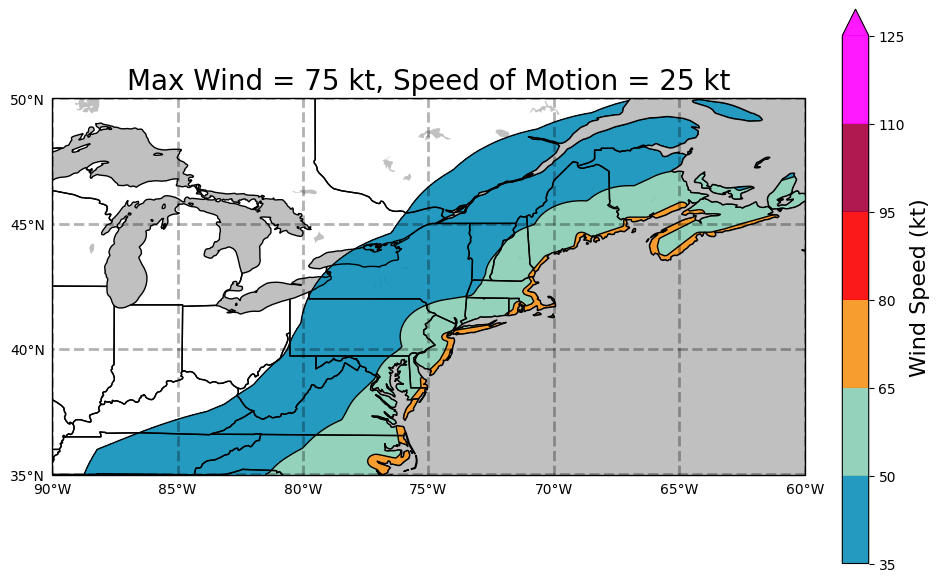
The tables below display examples of the Maximum Envelope of Winds. Three tables are shown, one for each of the regions: Gulf coast, East coast, and Northeast Coast. Click on the values to display the Maximum Envelope of Wind for a specific hurricane strength (as measured by the Saffir-Simpson Hurricane Wind Scale) and forward motion of a typical hurricane.
Examples of the Maximum Envelope of Wind
| Strength | Forward Motion (knots) | ||||
|---|---|---|---|---|---|
| Category 1 | 8 | 12 | 16 | 20 | 24 |
| Category 2 | 8 | 12 | 16 | 20 | 24 |
| Category 3 | 8 | 12 | 16 | 20 | 24 |
| Category 4 | 8 | 12 | 16 | 20 | 24 |
| Category 5 | 8 | 12 | 16 | 20 | 24 |
| Strength | Forward Motion (knots) | ||||
|---|---|---|---|---|---|
| Category 1 | 8 | 12 | 16 | 20 | 24 |
| Category 2 | 8 | 12 | 16 | 20 | 24 |
| Category 3 | 8 | 12 | 16 | 20 | 24 |
| Category 4 | 8 | 12 | 16 | 20 | 24 |
| Category 5 | 8 | 12 | 16 | 20 | 24 |
| Strength | Forward Motion (knots) | ||
|---|---|---|---|
| Category 1 | 15 | 25 | 35 |
| Category 2 | 15 | 25 | 35 |
| Category 3 | 15 | 25 | 35 |