|
|
HOME | ARCHIVES | FORECASTS | IMAGERY | ABOUT TPC | RECONNAISSANCE |
|---|
![[NCEP Logo]](graphics/ncep.gif)
|
Preliminary Report
|
|---|---|
|
STORM IMAGES
ANDREW'S DAMAGE
Additional damage images courtesy of
Roger Edwards
of the
Storm Prediction Center.
|
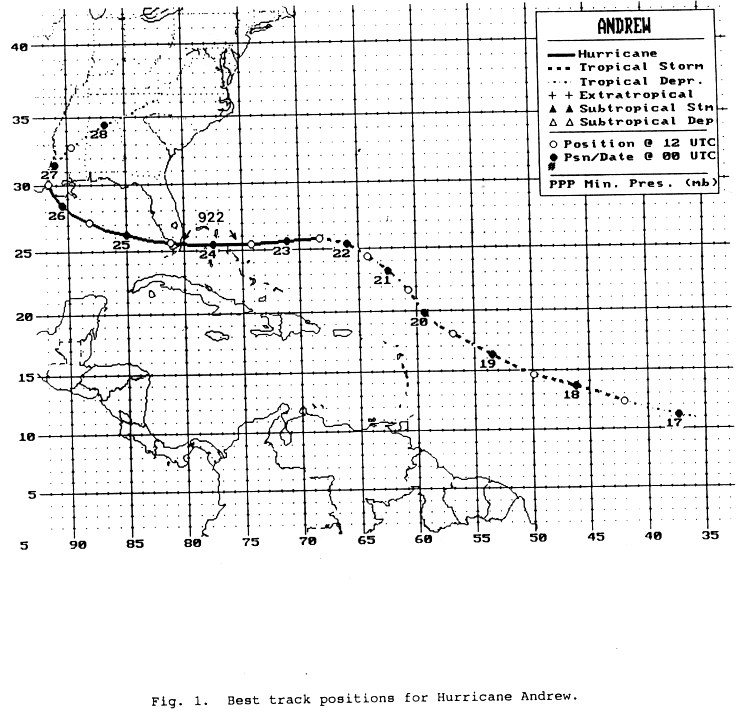
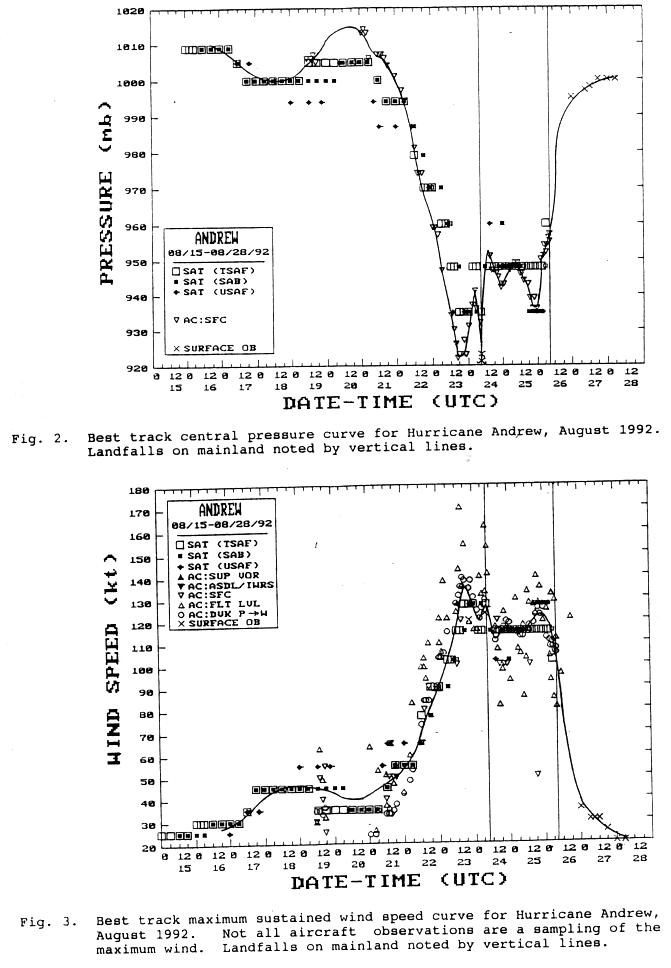
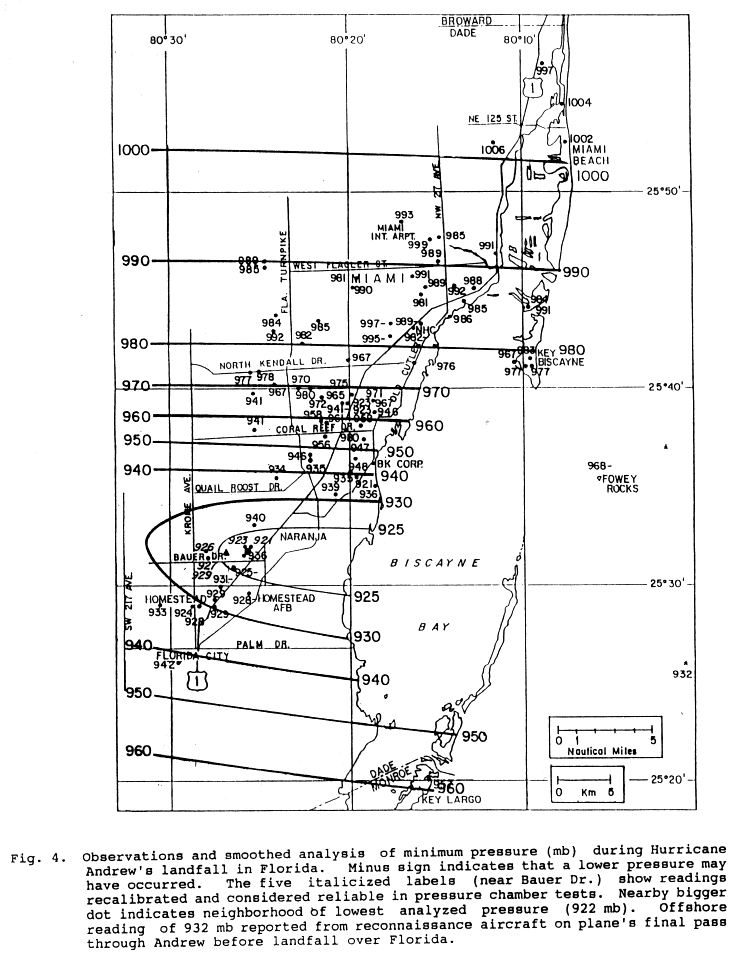
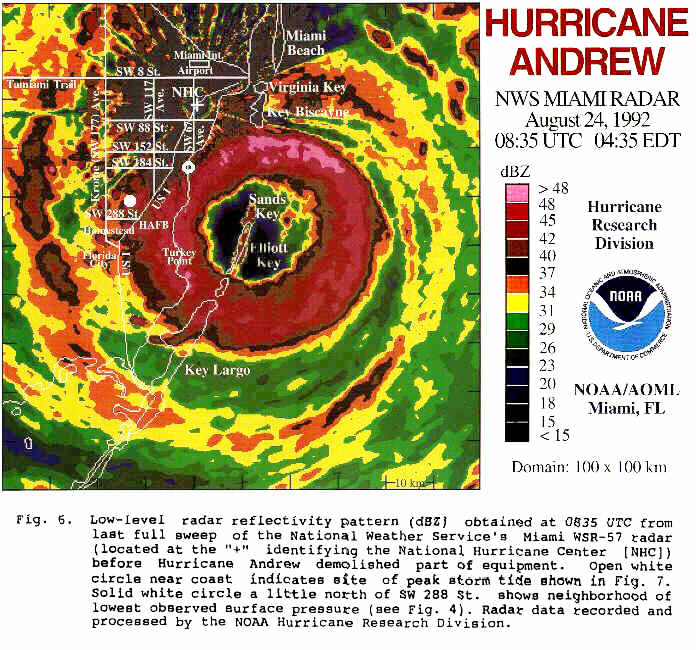
Andrew was a small and ferocious Cape Verde hurricane that wrought unprecedented economic devastation along a path through the northwestern Bahamas, the southern Florida peninsula, and south-central Louisiana. Damage in the United States is estimated to be near 25 billion, making Andrew the most expensive natural disaster in U.S. history1. The tropical cyclone struck southern Dade County, Florida, especially hard, with violent winds and storm surges characteristic of a category 4 hurricane (see addendum on upgrade to category 5) on the Saffir/Simpson Hurricane Scale, and with a central pressure (922 mb) that is the third lowest this century for a hurricane at landfall in the United States. In Dade County alone, the forces of Andrew resulted in 15 deaths and up to one-quarter million people left temporarily homeless. An additional 25 lives were lost in Dade County from the indirect effects of Andrew2. The direct loss of life seems remarkably low considering the destruction caused by this hurricane.
|
| Date/Time (UTC) | Position | Pressure (mb) |
Wind Speed (kt) | Stage | |
|---|---|---|---|---|---|
| Lat. (°N) | Lon. (°W) | ||||
| 16/1800 | 10.8 | 35.5 | 1010 | 25 | Tropical Depression |
| 17/0000 | 11.2 | 37.4 | 1009 | 30 | " " |
| 0600 | 11.7 | 39.6 | 1008 | 30 | " " |
| 1200 | 12.3 | 42.0 | 1006 | 35 | Tropical Storm |
| 1800 | 13.1 | 44.2 | 1003 | 35 | " " |
| 18/0000 | 13.6 | 46.2 | 1002 | 40 | " " |
| 0600 | 14.1 | 48.0 | 1001 | 45 | " " |
| 1200 | 14.6 | 49.9 | 1000 | 45 | " " |
| 1800 | 15.4 | 51.8 | 1000 | 45 | " " |
| 19/0000 | 16.3 | 53.5 | 1001 | 45 | " " |
| 0600 | 17.2 | 55.3 | 1002 | 45 | " " |
| 1200 | 18.0 | 56.9 | 1005 | 45 | " " |
| 1800 | 18.8 | 58.3 | 1007 | 45 | " " |
| 20/0000 | 19.8 | 59.3 | 1011 | 40 | " " |
| 0600 | 20.7 | 60.0 | 1013 | 40 | " " |
| 1200 | 21.7 | 60.7 | 1015 | 40 | " " |
| 1800 | 22.5 | 61.5 | 1014 | 40 | " " |
| 21/0000 | 23.2 | 62.4 | 1014 | 45 | " " |
| 0600 | 23.9 | 63.3 | 1010 | 45 | " " |
| 1200 | 24.4 | 64.2 | 1007 | 50 | " " |
| 1800 | 24.8 | 64.9 | 1004 | 50 | " " |
| 22/0000 | 25.3 | 65.9 | 1000 | 55 | " " |
| 0600 | 25.6 | 67.0 | 994 | 60 | " " |
| 1200 | 25.8 | 68.3 | 981 | 70 | Hurricane |
| 1800 | 25.7 | 69.7 | 969 | 80 | " |
| 23/0000 | 25.6 | 71.1 | 961 | 90 | " |
| 0600 | 25.5 | 72.5 | 947 | 105 | " |
| 1200 | 25.4 | 74.2 | 933 | 120 | " |
| 1800 | 25.4 | 75.8 | 922 | 135 | " |
| 24/0000 | 25.4 | 77.5 | 930 | 125 | " |
| 0600 | 25.4 | 79.3 | 937 | 120 | " |
| 1200 | 25.6 | 81.2 | 951 | 110 | " |
| 1800 | 25.8 | 83.1 | 947 | 115 | " |
| 25/0000 | 26.2 | 85.0 | 943 | 115 | " |
| 0600 | 26.6 | 86.7 | 948 | 115 | " |
| 1200 | 27.2 | 88.2 | 946 | 115 | " |
| 1800 | 27.8 | 89.6 | 941 | 120 | " |
| 26/0000 | 28.5 | 90.5 | 937 | 120 | " |
| 0600 | 29.2 | 91.3 | 955 | 115 | " |
| 1200 | 30.1 | 91.7 | 973 | 80 | " |
| 1800 | 30.9 | 91.6 | 991 | 50 | Tropical Storm |
| 27/0000 | 31.5 | 91.1 | 995 | 35 | " " |
| 0600 | 32.1 | 90.5 | 997 | 30 | Tropical Depression |
| 1200 | 32.8 | 89.6 | 998 | 30 | " " |
| 1800 | 33.6 | 88.4 | 999 | 25 | " " |
| 28/0000 | 34.4 | 86.7 | 1000 | 20 | " " |
| 0600 | 35.4 | 84.0 | 1000 | 20 | " " |
| 1200 | Merging with frontal system | ||||
| 23/1800 | 25.4 | 75.8 | 922 | 135 | Minimum Pressure |
| 24/0905 | 25.5 | 80.3 | 922 | 125 | " " |
| Landfall: | |||||
| northern Eleuthera Island, Bahamas | |||||
| 23/2100 | 25.4 | 76.6 | 923 | 130 | Hurricane |
| southern Berry Islands, Bahamas | |||||
| 24/0100 | 25.4 | 77.8 | 931 | 125 | Hurricane |
| Homestead Air Force Base, Florida | |||||
| 24/0905 | 25.5 | 80.3 | 922 | 125 | Hurricane |
| Point Chevreuil, Louisiana (20 n mi west-southwest of Morgan City) | |||||
| 26/0830 | 29.6 | 91.5 | 956 | 105 | Hurricane |
| Minimum sea-level pressure |
Maximum surface wind speed (kt) | |||||||
|---|---|---|---|---|---|---|---|---|
| Location | Pressure (mb) | Date/time (UTC) | 1-minute average |
Peak gust | Date/timea (UTC) | Storm surgeb (ft) |
Storm tideb (ft) | Rain (storm total) (in) |
| Bahamas | ||||||||
| Harbour Island | 935.0c | 23/2100 | 120c,d | 23/shortly after 2100 | ||||
| Nassau | 999.0c | 24/0000 | 80 | 100 | 24/0025 | |||
| The Current | 23 | |||||||
| Lower Bogue (1 n mi inland) | 16 | |||||||
| Florida East Coast and Keys | ||||||||
| Tamiami (TMB) | 988.0c,d | 110 | ||||||
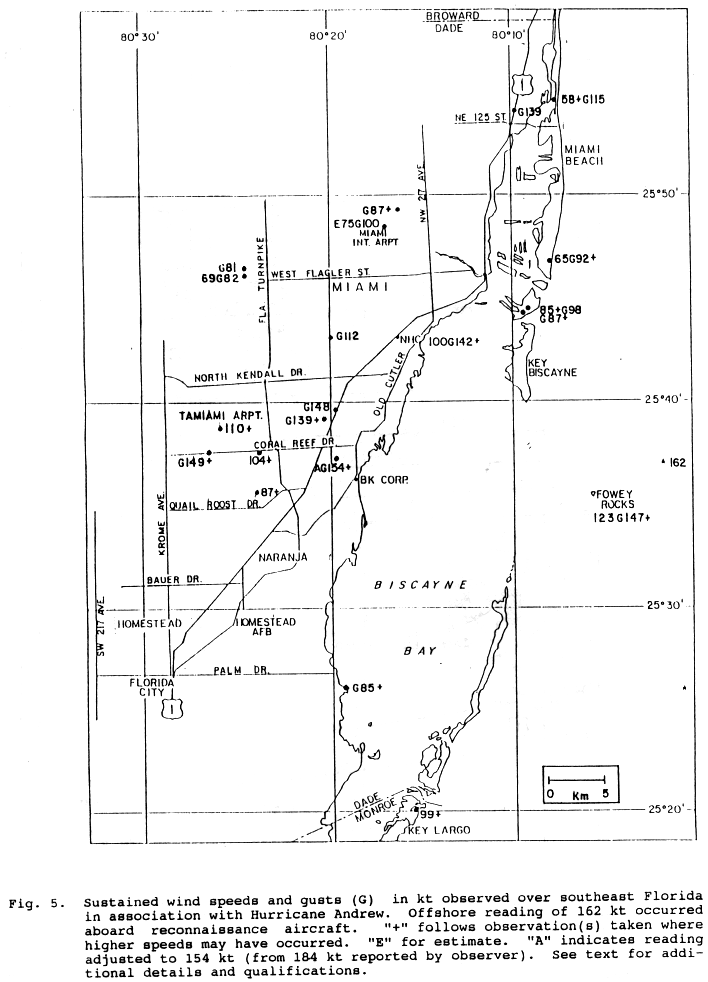
| Miami WSFO/NHC | 982.0c,d | 24/0900 | 100c-e | 142c-e | 24/0850 | |||
| Joe Bay (25.2°N 80.5°W) | 82j,k | 24/0938 | ||||||
| NOAA/AOML | 984.0 | 87c,d | ||||||
| Miami I. Arpt. (MIA) | 992.6 | 24/0900 | 75f | 100 | 24/0950 | 2.04 | ||
| Miami Beach DARDC | 65c | 92c,d | 24/0816 | |||||
| MIA4 (25.775°N 80.284°W) | 63o,p,c | 24/0901 | ||||||
| Haulover NOS NGWLMS | 1004.0 | 58c | 115 | 24/0900 | ||||
| Goodyear Blimp Base (Pompano) | 78-87e | 24/0900-0915f | ||||||
| MIA1 (25.797°N 80.291°W) | 56o,p,c | 81c | 24/0822 | |||||
| MIA2 (25.828°N 80.294°W) | 53o,p,c | 24/0845 | ||||||
| Ochopee (25.9°N 81.3°W) | 47j,l,c,e | 24/1232 | ||||||
| MIA6 (25.801°N 80.312°W) | 46o,p,c | 24/0826, 0856,0858 | ||||||
| S-140A (26.2°N 80.8°W) | 46m,n | 24/1122 | ||||||
| Manatee Bay (25.2°N 80.4°W) | 45j,k,c,e | 24/1038 | ||||||
| MIA3 (25.795°N 80.248°W) | 40o,p,c | 24/0845, 0859 | ||||||
| Monroe EOC (24.8°N 80.9°W) | 31 | 40c | 24/1028 | |||||
| Fort Lauderdale (FLL) | 53c,d | |||||||
| Palm Beach (PBI) | 1010.8 | 24/0259, 0420 | 43 | 51 | 24/1033 | |||
| Palm Beach ASOS | 42 | 24/1036 | ||||||
| Key West WSO (EYW) | 1010.1 | 24/1400 | 25 | 37 | 24/1614 | 0.33 | ||
| Miles City (26.2°N 81.2°W) | 24j,l,c,e | 24/1331 | ||||||
| Patrick AFB (COF) | 1016.2 | 24/0955 | 22 | 31 | 24/0731 | |||
| HQ (26.6°N 80.1°W) | 22m,n,c,e | 24/0929 | ||||||
| Marathon (24.7°N 81.1°W) | 18o,c | 26 | 24/1155 | |||||
| S-5A (26.6°N 80.4°W) | 16m,n | 24/1242 | ||||||
| Melbourne (MLB) | 1016.3 | 24/0950 | 15 | 21 | 24/1151 | |||
| Orlando (MCO) | 1016.9 | 24/0950 | 30 | 24/1850 | ||||
| NASA Shuttle (X68) | 1016.9 | 24/0855 | 11 | 23 | 24/1755 | |||
| Titusville (TIX) | 1017.9 | 24/1053 | 8 | 14 | 24/1149 | 0.80c | ||
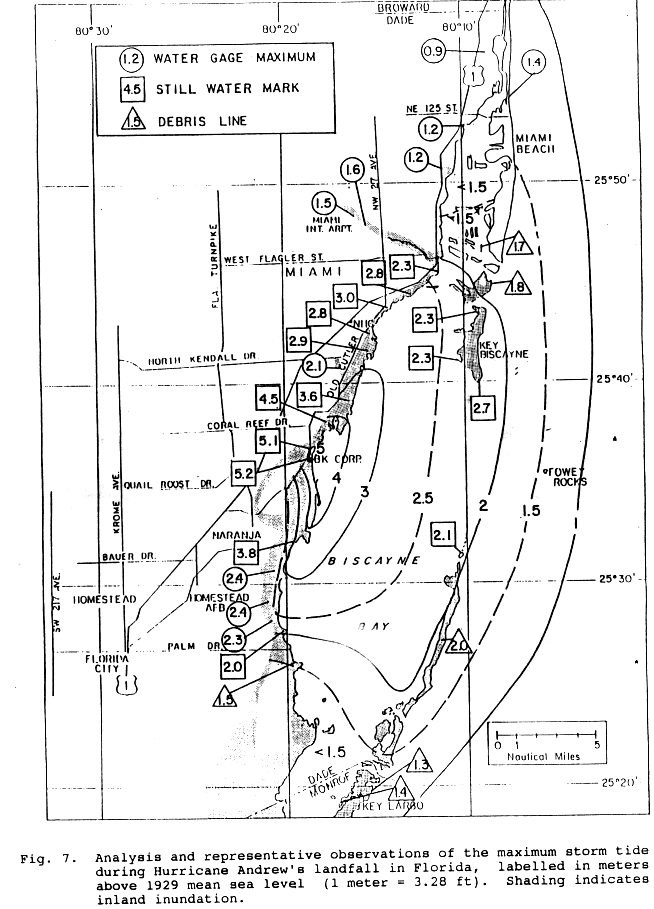
| East Perrine | 16.9 (see Fig. 4) | |||||||
| Florida West Coast | ||||||||
| Collier County (EOC) | 87e | 24/ | ||||||
| Captiva Fire Station | 63 | |||||||
| Marco Island (26.0°N 81.7°W) | 34c,d,o | 24/1220 | ||||||
| Fort Myers (RSW) | 1010.2 | 24/1347, 1446 | 30 | 45 | 24/1446, 1547 | 0.56 | ||
| Cape Coral | ||||||||
| Glades County (EOC) | 44 | 24/between 1100 and 1200 | ||||||
| Clrwtr./St. P. Arpt. | 30 | 40 | 24/1625 | |||||
| Goodland | 6.0g | |||||||
| Everglades City | 6.0g | |||||||
| Fort Myers Beach | 2.0 | |||||||
| Venice | 1.8 | |||||||
| Anna Marie Island | 1.5 | |||||||
| Homosassa | 1.5 | |||||||
| Gulf Harbors | 1.5 | |||||||
| Indian Rocks Beach | 1.0 | |||||||
| Louisiana | ||||||||
| Morgan City (P42) | 80e | 94e | ||||||
| Baton Rouge (BTR) | 996.5 | 26/1427 | 42 | 61 | 26/1452 | 5.70 | ||
| New Orleans (MSY) | 1006.6 | 26/0805 | 39 | 57 | 26/0950 | 5.70 | ||
| Bayou Bienvenue | 6.28 | |||||||
| Salt Point AMOS (P92) | 40 | 72 | 26/0728 | |||||
| Lafayette (LFT) | 990.5 | 26/1250 | 46 | 62 | 26/1057 | 5.51 | ||
| Lake Charles (LCH) | 1008.5 | 21 | 34 | 26/2152 | 0.05 | |||
| Berwick Fire Stn. | 83e | 104e | ||||||
| Jeanerette | 975.0 | 71 | 78c | |||||
| Jeanerette | 67 | 75 | 26/0845 | |||||
| Near Brusly | 990.2 | 26/1337 | 69 | 90c | 26/1310 | 5.05 | ||
| Lafayette Courthouse | 90e | |||||||
| Mooring 17 (29.2°N 92.0°W) | 994.9 | 26/0930 | ||||||
| Cocodrie | 8.0 | |||||||
| Burns Point (St. Mary Parish) | 6.8h | |||||||
| Bayou Dupre | 6.5 | |||||||
| Bayou Bienvenue | 6.3 | |||||||
| NWS HANDAR east N. Orleans | 5.6 | |||||||
| Port Fourchon | 5.0h | |||||||
| N end of causeway | 4.9 | |||||||
| Industrial canal | 4.4 | |||||||
| Marina | 4.3 | |||||||
| Rigolets | 4.2 | |||||||
| Grand Isle | 3.5h | |||||||
| Alabama | ||||||||
| Huntsville (HSV) | 1000.3 | 27/2250 | 22 | 36 | 27/1742 | 0.92 | ||
| Birmingham (BHM) | 1001.7 | 27/2215 | 19 | 35 | 27/1640 | 1.77 | ||
| Montgomery (MGM) | 1008.8 | 27/2045 | 23 | 31 | 27/2307 | 1.55 | ||
| Mobile (MOB) | 1010.1 | 27/2051 | 26 | 35 | 25/1844 | 0.64 | ||
| Mobile State Docks | 2.6 | 3.5 | ||||||
| Dauphin Island | 6.0 | |||||||
| Georgia | ||||||||
| Atlanta (ATL) | 1005.4 | 28/0400 | 39 | 27/2039 | ||||
| Mississippi | ||||||||
| Jackson (JAN) | 998.6 | 26/0750 | 28 | 49 | 27/0219 | 4.79 | ||
| Tupelo (TUP) | 24 | 36 | 27/2000 | 1.86 | ||||
| Meridian (MEI) | 1004.4 | 25 | 48 | 27/0945 | 5.29 | |||
| State Port (Gulfport) | 39 | 27/1951 | ||||||
| Bay St. Louis | 4.5f | |||||||
| Texas | ||||||||
| Port Arthur (BPT) | 1011.5 | 26/1000 | 22 | 30 | 26/1953 | |||
| Sabine Pass | 1.1 | 1.3 | ||||||
| Ship reports | ||||||||
| OYGK2 (29.5°N 80.6°W) | 60 | 25/1200 | ||||||
| ELLE2 (19.4°N 56.6°W) | 1013.5 | 19/1500 | 35 | 19/1500 | ||||
| C6KD (28.1°N 79.2°W) | 1015.5 | 24/0600 | 35 | 24/0600 | ||||
| Gulf of Mexico platformsc,e | ||||||||
| SS 198G (28.2°N 92.0°W) | 78 | 100 | 26/0330 | |||||
| EC 83H (28.2°N 92.0°W) | 46 | 49 | 26/0330 | |||||
| EC 42B (29.5°N 92.8°W) | 38 | 88 | 26/0430 | |||||
| SM 136B (28.2°N 92.0°W) | 38 | 44 | 25/2230 | |||||
|
|
|
|---|
| Location | Total Rain (in) | Location | Total Rain (in) | |
|---|---|---|---|---|
| Florida: | ||||
| S-124 (Broward County) | 7.79 | Everglades Park (Collier County) | * 4.50 | |
| S-21A (Dade County) | 7.41 | S-18C (Dade County) | 4.48 | |
| S-20G (Dade County) | 5.19 | S-20F (Dade County) | 4.12 | |
| S-37A (Broward County) | 5.14 | Marco Island | * 3.50 | |
| S-39 (Broward/Palm Beach Counties) | 5.12 | S-308 (Lake Okeechobee area) | 3.47 | |
| S-80 (Martin-St. Lucie) | 4.94 | Cudjoe Key | 2.02 | |
| Louisiana: | ||||
| Hammond | 11.92 | Butte La Rose | 7.90 | |
| Robert | 11.02 | Ponchatoula | 7.54 | |
| Amite | 10.36 | Mt. Herman | 7.50 | |
| Morgan City | 9.31 | Franklin | 7.03 | |
| Manchac | 8.75 | WSFO Slidell | 5.06 | |
| Jeanerette | 7.96 | Jena 4WSW | 4.42 | |
| Alabama: | ||||
| Aliceville | 4.40 | WRTA1 Wright | 2.89 | |
| Tuscaloosa | 3.60 | CBTA1 Colbert | 2.75 | |
| MRGA1 Morgan | 3.46 | AKDA1 Lexington | 2.66 | |
| MRZA1 Mount Roszell | 3.21 | OAKA1 Oakland | 2.62 | |
| CDCA1 Red Bay Creek | 2.90 | |||
| Georgia: | ||||
| Hurst | 5.24 | SCHG1 Suches G. Creek | 3.32 | |
| Mountain City | 4.60 | TUSG1 Titus | 3.13 | |
| Burton | 4.31 | Tallulah | 3.05 | |
| Clayton | 4.30 | Jasper | 2.67 | |
| Nacoochee Pwr | 3.83 | BRDG1 Blue Ridge Dam | 2.65 | |
| Helen | 3.40 | EPWG1 Epworth H. Store | 2.64 | |
| Kentucky: | ||||
| BLWK2 | 2.56 | |||
| Mississippi: | ||||
| Sumrall | 9.30 | Vicksburg | 5.95 | |
| Pelahatchie (gage) | 8.20 | McComb | 5.93 | |
| Yazoo City | 7.63 | Ofahoma | 5.82 | |
| Crystal Springs | 7.24 | Bay St. Louis | 5.72 | |
| Pelahatchie (co-op) | 7.07 | White Oak | 5.65 | |
| Collins | 7.04 | Forest | 5.59 | |
| Union Church | 7.04 | Liberty | 5.59 | |
| Brookhaven | 7.02 | Goshen Springs | 5.52 | |
| Mize | 6.71 | Port Gibson | 5.51 | |
| Rockport | 6.36 | Meadville | 5.45 | |
| Monticello | 6.36 | Tylertown | 5.38 | |
| Booneville | 6.30 | Columbia | 5.32 | |
| Good Hope | 6.14 | Philadelphia | 5.06 | |
| North Carolina: | ||||
| HDSN7 Highlands | 4.68 | RMNN7 Rosman | 2.62 | |
| WLGN7 F-Wallace Gap | 2.73 | |||
| Tennessee: | ||||
| ELKT1 Elkton | 3.80 | LNVT1 Lynnville | 2.97 | |
| WNBT1 Waynesboro | 3.64 | PICT1 Pickwick Dam | 2.95 | |
| GEOT1 Georgetown | 3.43 | CLET1 Cleveland | 2.91 | |
| IRCT1 Iron City-S.C. | 3.33 | CLBT1 Columbia | 2.80 | |
| BGLT1 Big Lick | 3.25 | DYNT1 Dime | 2.74 | |
| CBOT1 Crab Orchard | 3.07 | LEWT1 Lewisburg | 2.58 | |
| CLLT1 Collinwood | 3.07 | CSV Crossville Arpt. | 2.57 | |
| PSKT1 Pulaski | 3.03 | PKVT1 Pikeville | 2.50 | |
| Minimum sea-level pressure |
Maximum wind speed a (kt) | |||||
|---|---|---|---|---|---|---|
| Platform | Date/time | Location (deg) | Pressure (mb) |
Date/time (UTC) | average | Peak gust |
| Fowey Rocks C-MAN FWYF1 | 24/0800 | 25.6N 80.1W | 967.5 b,c | 24/0800 | 123 b,c | 147 b,c |
| Bullwinkle Platform BUSL1 | 25/2225 | 27.9N 90.9W | 998.5 | 25/2300 | 52 | 63 b |
| Molasses Reef C-MAN MLRF1 | 24/1000 | 25.0N 80.4W | 998.5 | 24/0900 | 48 | 59 |
| Eastern Gulf Buoy 42003 | 25/0250 | 25.9N 85.9W | 997.4 | 25/0400 | 45 | 63 |
| Grand Isle C-MAN GDIL1 | 25/2200 | 29.2N 90.0W | 1005.2 | 25/2300 | 48 | 73 |
| Southwest Pass C-MAN BURL1 | 25/2100 | 28.9N 89.4W | 1006.1 | 25/2200 | 56 | 80 |
| Sombrero Key C-MAN SMKF1 | 24/1130 | 24.6N 81.2W | 1007.7 | 24/1100 | 34 | 42 |
| Lena Platform C-MAN LNEL1 | 28.2N 89.1W | 1007.7 | 25/1600 | |||
| Eleuthera Buoy 41016 | 24/0040 | 24.6N 76.5W | 1007.9 | 23/2040 | 29 | 35 b |
| Sand Key C-MAN SANF1 | 24/1600 | 24.5N 81.9W | 1010.2 | 24/1100,1400 | 30 | 43 b |
| Central Gulf Buoy 42001 | 25/1650 | 25.9N 89.7W | 1010.8 | 25/0950 | 24 | 29 |
| Settlement Point C-MAN SPGF1 | 24/0500 | 26.7N 79.0W | 1012.7 | 24/0600 | 38 | 47 |
| Buoy 42007 | 25/1850 | 30.1N 88.8W | 1013.5 | 25/2250 | 30 | 46 |
| Dauphin Island C-MAN DPIA1 | 25/2100 | 30.2N 88.1W | 1016.1 | 26/0000 | 32 | 46 |
|
|
|
|---|
| Deaths | Damage ($ Billion) | ||||
|---|---|---|---|---|---|
| Direct | Indirect | ||||
| Bahamas | 3 | 1 | 0.25 | ||
| Florida: | 15 | 29 | 25 | ||
| Dade County | 15 | 25 | 25 | ||
| Broward County | 0 | 3 | 0.1 | ||
| Monroe County | 0 | 1 | 0.131 | ||
| Collier County | 0 | 0 | 0.03 | ||
| Louisiana: | 8 | 9 | 1 | ||
| St. John the Baptist Parish | 2 | 0 | |||
| Offshore | 6 | 0 | |||
| Lafayette Parish | 0 | 2 | 0.017 | ||
| Vermillion Parish | 0 | 0 | 0.001 | ||
| Iberville Parish | 0 | 1 | |||
| Terrebonne Parish | 0 | 3 | |||
| Orleans Parish | 0 | 1 | |||
| Plaquemines Parish | 0 | 1 | |||
| Iberia Parish | 0 | 1 | |||
| Georgia | 0.001 | ||||
| Total | 26 | 39 | 26 | ||
Note: The Miami Herald reported on 31 January 1993 that it could relate at least 43 additional (indirect)
deaths in Dade County to Hurricane Andrew.
| Item | Loss ($ Billion) | Notes |
|---|---|---|
| 1. Common insured private property | 15.0 | From American Insurance Services Group, Inc., property February 1993 based on major insurers. Includes homes, mobile homes, commercial and industrial properties and their contents; boats; autos; farm equipment and structures; "time-element" losses of living expenses and "business interruption." |
| 2. Uninsured homes | 0.35 | From The Miami Herald (MH), 16 February 1993 for cost to rebuild. May not include contents. |
| 3. Government property: | ||
| a. Federal Government: | ||
| i. Homestead AFB | 0.5 | From CARCAH |
| ii. Other | ? | |
| b. State Governments | ? | |
| c. County Governments | 0.287 | Uninsured loss to Metro-Dade reported by Audit and Management Services Department on 25 January 1993. |
| d. City Governments | ? | |
| e. Schools | 0.358 | MH, 10 September 1992 for K-12, FIU, Dade County CC and UM. FEMA estimate of $0.06 billion for school repair on 27 February 1993. |
| 4. Agriculture | 1.0 | MH, 10 September 1992. Part of loss covered in #1. Excludes loss of row crops. |
| 5. Environment: | ||
| a. Clean-up | 2.0 | Amount requested of Federal Government by State of Florida. FEMA estimate of $0.375 billion on 27 February 1993. |
| b. Parks, Marinas, Beaches and Reefs | 0.124 | MH, 10 September 1992. |
| c. Landscaping | ? | |
| 6. Aircraft | 0.02 | From survey of aircraft underwriters. |
| 7. Flood Claims | 0.096 | From FEMA Flood Insurance Administration. |
| 8. Uniformed and Overtime Assistance (e.g., military, police, National Guard and their associated expenses) | - | Not included |
| 9. Deductibles | ? | |
| 10. Other | ? | |
| Forecast period (hours) | Forecast period (hours) | |||||||||||
|---|---|---|---|---|---|---|---|---|---|---|---|---|
| Model | 12 | 24 | 36 | 48 | 72 | Model | 12 | 24 | 36 | 48 | 72 | |
| Official (no. of cases) | 33 | 65 | 106 | 141 | 243 | CLIPER | 35 | 81 | 148 | 233 | 437 | |
| (37) | (35) | (33) | (31) | (27) | (37) | (35) | (33) | (31) | (27) | |||
| AVNO | 60 | 75 | 89 | 97 | 132 | BAMD | 45 | 93 | 141 | 182 | 268 | |
| (15) | (15) | (14) | (13) | (11) | (37) | (35) | (33) | (31) | (27) | |||
| BAMM | 40 | 81 | 121 | 151 | 229 | BAMS | 39 | 77 | 114 | 135 | 197 | |
| (37) | (35) | (33) | (31) | (27) | (37) | (35) | (33) | (31) | (27) | |||
| QLM | 39 | 64 | 93 | 130 | 192 | NHC90 | 35 | 77 | 135 | 197 | 330 | |
| (19) | (18) | (17) | (16) | (14) | (37) | (35) | (33) | (31) | (27) | |||
| VBAR | 32 | 60 | 93 | 138 | 287 | GFDL | 36 | 71 | 93 | 117 | 209 | |
| (23) | (23) | (23) | (23) | (23) | (9) | (9) | (9) | (9) | (7) | |||
| Date/Time (UTC) | Action | Region |
|---|---|---|
| 22/1500 | Hurricane Watch | Northwest Bahamas from Andros and Eleuthera Islands northward through Grand Bahama and Great Abaco |
| 22/2100 | Hurricane Warning | Northwest Bahamas from Andros and Eleuthera Islands northward through Grand Bahama and Great Abaco |
| Hurricane Watch | Florida east coast from Titusville southward through the Florida Keys including the Dry Tortugas | |
| 23/0600 | Hurricane Warning | Central Bahamas including Cat Island, Great Exuma, San Salvador, and Long Island |
| 23/1200 | Hurricane Warning | Florida east coast from Vero Beach southward through the Florida Keys to the Dry Tortugas including Florida Bay |
| Tropical Storm Warning | Florida east coast north of Vero Beach to Titusville | |
| Hurricane Watch | Florida west coast south of Bayport including the greater Tampa area to north of Flamingo | |
| 23/1800 | Hurricane Warning | Florida west coast south of Venice and Lake Okeechobee |
| Tropical Storm Warning | Florida west coast north of Venice to Bayport | |
| 24/0900 | Hurricane Warning discontinued | Bahamas except for Bimini and Grand Bahama |
| 24/1300 | Hurricane Warning discontinued | Remainder of the Bahamas |
| Hurricane Warning discontinued | Florida except for Lake Okeechobee and the west coast south of Venice to Flamingo | |
| Tropical Storm Warning and Hurricane Watch discontinued | Florida east coast from Vero Beach to Titusville and Florida west coast from Venice to Bayport | |
| Hurricane Watch | Northern Gulf coast from Mobile, Alabama to Sabine Pass, Texas | |
| 24/1800 | Hurricane Warning discontinued | Remainder of Florida |
| 24/2100 | Hurricane Warning | Northern Gulf coast from Pascagoula, Mississippi through Vermillion Bay, Louisiana |
| 25/0900 | Hurricane Warning | West of Vermillion Bay, Louisiana to Port Arthur, Texas |
| Hurricane Watch | West of Port Arthur through High Island, Texas | |
| 25/1500 | Hurricane Warning | West of Port Arthur through the Bolivar Peninsula Texas |
| Hurricane Watch | West of the Bolivar Peninsula to Freeport, Texas | |
| 26/0700 | Hurricane Warning discontinued | East of Grand Isle, Louisiana |
| Hurricane Watch discontinued | West of the Bolivar Peninsula | |
| 26/1100 | Hurricane Warning discontinued | West of Port Arthur, Texas |
| 26/1300 | Hurricane Warning discontinued | West of Cameron, Louisiana |
| 26/1700 | Hurricane Warning discontinued | Remainder of Gulf coast |
| Location | Type | Lead Time (Hours) |
|---|---|---|
| Northwest Bahamas | Hurricane Watch | 30 |
| Hurricane Warning | 24 | |
| Southeast Florida | Hurricane Watch | 36 |
| Hurricane Warning | 21 | |
| South-central Louisiana | Hurricane Watch | 43 |
| Hurricane Warning | 24 |
|
|
Table 7. Chances of the center of Hurricane Andrew passing within 65 miles of
listed locations by date and time (EDT) indicated; probabilities in
percent with X for less than 2 percent.
ADVISORY ISSUE TIME: 16/11PM 17/5AM 17/11AM 17/5PM 17/11PM PROBABILITY END TIME: 19/8PM 20/2AM 20/8AM 20/2PM 20/8PM SVMG 110N 640W 4 5 7 6 X TTPP 106N 614W 7 8 9 6 X TTPT 112N 608W 8 10 11 8 X TGPY 120N 618W 8 10 11 9 X TBPB 131N 595W 11 14 15 14 4 TVSV 131N 612W 9 11 14 12 3 TLPL 138N 610W 10 12 15 14 5 TFFF 146N 610W 10 12 15 15 8 TDPR 153N 614W 10 12 15 15 10 TFFR 163N 615W 10 12 16 16 13 TAPA 171N 618W 9 11 15 16 15 TKPK 173N 627W 8 10 14 15 14 TNCM 181N 631W 8 9 14 14 14 TISX 177N 648W 6 7 12 12 9 TIST 183N 650W 6 7 11 12 10 TJPS 180N 666W 4 5 9 10 6 TJSJ 184N 661W 4 5 10 11 8 MDSD 185N 697W X X 5 5 X MDCB 176N 714W X X 2 3 X MTPP 186N 724W X X 2 2 X TNCC 122N 690W X X 3 2 X MDPP 198N 707W X X 3 4 X MBJT 215N 712W X X 2 3 X MYMM 224N 730W X X X 2 X ST CROIX VI 6 7 12 12 9 ST THOMAS VI 6 7 11 12 10 SAN JUAN PR 4 5 10 11 8 PONCE PR 4 5 9 10 6 ADVISORY ISSUE TIME: 18/5AM 18/11AM 18/5PM 18/11PM 19/5AM PROBABILITY END TIME: 21/2AM 21/8AM 21/2PM 21/8PM 22/2AM TBPB 131N 595W 4 3 X X X TVSV 131N 612W 3 3 X X X TLPL 138N 610W 6 6 2 X X TFFF 146N 610W 9 9 4 2 2 TDPR 153N 614W 11 13 7 4 3 TFFR 163N 615W 15 18 13 8 6 TAPA 171N 618W 18 21 17 14 10 TKPK 173N 627W 16 20 17 14 12 TNCM 181N 631W 17 21 19 19 17 TISX 177N 648W 12 16 14 14 12 TIST 183N 650W 13 17 16 16 15 TJPS 180N 666W 8 13 12 12 11 TJSJ 184N 661W 10 15 14 14 14 MDSD 185N 697W 3 6 7 8 8 MDCB 176N 714W X 2 3 3 3 MTPP 186N 724W X 2 3 3 3 MDPP 198N 707W 3 6 8 8 9 MBJT 215N 712W 3 7 8 9 11 MYMM 224N 730W X 4 5 6 8 MYSM 241N 745W X 2 3 4 6 MYEG 235N 758W X X 2 2 3 MYNN 251N 775W X X X X 2 ST CROIX VI 12 16 14 14 12 ST THOMAS VI 13 17 16 16 15 SAN JUAN PR 10 15 14 14 14 PONCE PR 8 13 12 12 11 ADVISORY ISSUE TIME: 19/11AM 19/5PM 19/11PM 20/5AM 20/11AM PROBABILITY END TIME: 22/8AM 22/2PM 22/8PM 23/2AM 23/8AM TAPA 171N 618W 2 X X X X TKPK 173N 627W 4 X X X X TNCM 181N 631W 7 3 X X X TISX 177N 648W 6 3 2 2 2 TIST 183N 650W 9 5 3 3 3 TJPS 180N 666W 7 5 4 4 4 TJSJ 184N 661W 9 6 4 4 4 MDSD 185N 697W 6 7 6 6 6 MDCB 176N 714W 3 4 3 3 4 MTPP 186N 724W 3 6 4 4 5 MDPP 198N 707W 8 11 9 9 9 MBJT 215N 712W 11 16 13 13 12 MYMM 224N 730W 8 14 11 12 11 MYSM 241N 745W 6 14 9 10 10 MYEG 235N 758W 3 10 6 6 7 MYNN 251N 775W X 8 3 4 5 MUGM 200N 751W X 6 3 3 4 MUCM 214N 779W X 3 X X 2 MYAK 241N 776W X 7 3 3 5 MTCA 183N 738W X 4 3 3 3 MYGF 266N 787W X 6 2 2 4 ST CROIX VI 6 3 2 2 2 ST THOMAS VI 9 5 3 3 3 SAN JUAN PR 9 6 4 4 4 PONCE PR 7 5 4 4 4 MARATHON FL X 2 X X X MIAMI FL X 3 X X 2 W PALM BEACH FL X 4 X X 2 FT PIERCE FL X 3 X X 2 COCOA BEACH FL X 3 X X X DAYTONA BEACH FL X 2 X X X MARCO ISLAND FL X 2 X X X BERMUDA X X 3 X 3 ADVISORY ISSUE TIME: 20/5PM 20/11PM 21/5AM 21/11AM 21/5PM PROBABILITY END TIME: 23/2PM 23/8PM 24/2AM 24/8AM 24/2PM MDSD 185N 697W 4 X X X X MDCB 176N 714W 2 X X X X MTPP 186N 724W 4 X 2 2 2 MDPP 198N 707W 7 3 3 3 2 MBJT 215N 712W 12 6 8 6 6 MYMM 224N 730W 13 7 9 8 8 MYSM 241N 745W 13 8 12 11 12 MYEG 235N 758W 10 5 8 9 10 MYNN 251N 775W 8 3 7 9 10 MUGM 200N 751W 5 X 3 4 3 MUCM 214N 779W 4 X 2 5 5 MYAK 241N 776W 7 2 6 8 9 MTCA 183N 738W 3 X 2 2 X MYGF 266N 787W 6 2 6 9 9 MUHA 230N 824W X X X 3 3 MKJS 185N 779W X X X 2 2 MWCG 193N 814W X X X 2 X MUCF 221N 805W X X X 4 4 MUSN 216N 826W X X X 2 2 MARATHON FL 2 X X 5 6 MIAMI FL 3 X 2 7 7 W PALM BEACH FL 4 X 3 7 8 FT PIERCE FL 3 X 3 7 8 COCOA BEACH FL 3 X 3 6 7 DAYTONA BEACH FL 2 X 2 6 6 MARCO ISLAND FL 2 X X 5 6 BERMUDA 2 6 3 2 2 MYRTLE BEACH SC 2 X 3 4 4 WILMINGTON NC 2 2 4 3 4 MOREHEAD CITY NC 3 3 5 3 3 CAPE HATTERAS NC 2 3 5 3 3 CHARLESTON SC 2 X 3 4 4 NORFOLK VA X X 3 2 2 OCEAN CITY MD X X 2 X X SAVANNAH GA X X 2 4 4 KEY WEST FL X X X 5 5 JACKSONVILLE FL X X X 5 5 FT MYERS FL X X X 5 6 VENICE FL X X X 5 5 TAMPA FL X X X 5 5 CEDAR KEY FL X X X 4 4 ST MARKS FL X X X 3 3 APALACHICOLA FL X X X X 3 PANAMA CITY FL X X X X 2 GULF 29N 85W X X X X 3 GULF 29N 87W X X X X 2 ADVISORY ISSUE TIME: 21/11PM 22/5AM 22/11AM 22/5PM 22/11PM PROBABILITY END TIME: 24/8PM 25/2AM 25/8AM 25/2PM 25/8PM MBJT 215N 712W 3 2 X X X MYMM 224N 730W 6 6 5 X X MYSM 241N 745W 11 12 16 19 21 MYEG 235N 758W 9 10 12 15 11 MYNN 251N 775W 11 13 17 27 35 MUGM 200N 751W 3 X X X X MUCM 214N 779W 4 5 6 7 2 MYAK 241N 776W 9 11 14 22 27 MYGF 266N 787W 11 13 17 24 24 MUHA 230N 824W 4 5 8 14 16 MWCG 193N 814W X X X 4 X MUCF 221N 805W 4 5 8 12 10 MUSN 216N 826W 2 3 6 10 9 MUAN 219N 850W 2 3 5 9 11 MMCZ 205N 869W X X 3 5 5 MARATHON FL 6 8 12 19 23 MIAMI FL 8 10 14 21 23 W PALM BEACH FL 9 11 15 20 20 FT PIERCE FL 9 11 15 18 16 COCOA BEACH FL 9 11 14 16 13 DAYTONA BEACH FL 8 10 12 13 10 MARCO ISLAND FL 7 9 13 19 21 BERMUDA 2 X X X X MYRTLE BEACH SC 6 6 5 X X WILMINGTON NC 5 5 4 X X MOREHEAD CITY NC 5 5 3 X X CAPE HATTERAS NC 4 4 2 X X CHARLESTON SC 6 7 6 3 2 NORFOLK VA 2 2 X X X SAVANNAH GA 6 7 7 5 4 KEY WEST FL 5 7 11 18 21 JACKSONVILLE FL 7 8 9 9 7 FT MYERS FL 7 9 13 18 19 VENICE FL 6 8 12 17 17 TAMPA FL 7 9 11 15 14 CEDAR KEY FL 6 8 10 13 11 ST MARKS FL 4 6 8 10 9 APALACHICOLA FL 4 5 7 11 10 PANAMA CITY FL 3 5 6 10 9 GULF 29N 85W 4 6 8 12 11 GULF 29N 87W 2 4 6 11 11 PENSACOLA FL 2 3 5 9 8 MOBILE AL 2 X 4 8 7 MMMD 210N 897W X X 2 3 5 GULFPORT MS X X 3 8 7 BURAS LA X X 3 8 9 NEW ORLEANS LA X X 3 7 7 NEW IBERIA LA X X 2 5 6 GULF 28N 89W X X 4 10 11 GULF 28N 91W X X 2 7 9 FREEPORT TX X X X 2 4 PORT O CONNOR TX X X X 2 3 PORT ARTHUR TX X X X 3 4 GALVESTON TX X X X 3 4 GULF 28N 93W X X X 5 7 GULF 28N 95W X X X 3 5 GULF 27N 96W X X X 2 4 BROWNSVILLE TX X X X X 3 CORPUS CHRISTI TX X X X X 3 GULF 25N 96W X X X X 4 ADVISORY ISSUE TIME: 23/5AM 23/11AM 23/5PM PROBABILITY END TIME: 26/2AM 26/8AM 26/2PM MYSM 241N 745W 26 13 X MYEG 235N 758W 12 2 X MYNN 251N 775W 51 68 99 MYAK 241N 776W 34 34 17 MYGF 266N 787W 36 43 61 MUHA 230N 824W 18 15 10 MUCF 221N 805W 10 5 X MUSN 216N 826W 9 5 X MUAN 219N 850W 11 9 6 MMCZ 205N 869W 5 4 X MARATHON FL 30 32 37 MIAMI FL 34 40 56 W PALM BEACH FL 30 33 47 FT PIERCE FL 23 23 28 COCOA BEACH FL 17 16 16 DAYTONA BEACH FL 11 10 9 MARCO ISLAND FL 28 31 42 CHARLESTON SC X X X SAVANNAH GA 3 2 X KEY WEST FL 27 28 31 JACKSONVILLE FL 7 6 X FT MYERS FL 25 27 37 VENICE FL 21 22 29 TAMPA FL 17 17 20 CEDAR KEY FL 13 12 13 ST MARKS FL 10 10 9 APALACHICOLA FL 12 12 12 PANAMA CITY FL 12 11 11 GULF 29N 85W 14 14 15 GULF 29N 87W 14 14 15 PENSACOLA FL 11 11 11 MOBILE AL 10 11 11 MMMD 210N 897W 5 5 X GULFPORT MS 10 11 12 BURAS LA 12 13 14 NEW ORLEANS LA 11 12 13 NEW IBERIA LA 9 11 13 GULF 28N 89W 14 16 17 GULF 28N 91W 12 14 16 FREEPORT TX 7 9 12 PORT O CONNOR TX 6 8 11 PORT ARTHUR TX 7 10 12 GALVESTON TX 7 10 12 MMSO 238N 982W 2 3 X MMTM 222N 979W X 2 X GULF 28N 93W 10 12 14 GULF 28N 95W 7 10 12 GULF 27N 96W 6 9 11 BROWNSVILLE TX 4 6 8 CORPUS CHRISTI TX 4 7 9 GULF 25N 96W 4 7 8 ADVISORY ISSUE TIME: 23/11PM 24/5AM 24/11AM 24/5PM PROBABILITY END TIME: 26/8PM 27/2AM 27/8AM 27/2PM MYGF 266N 787W 60 30 X X MUHA 230N 824W 4 2 X X MUAN 219N 850W 3 3 X X MMCZ 205N 869W X 2 X X MARATHON FL 53 62 X X MIAMI FL 71 99 X X W PALM BEACH FL 42 73 X X FT PIERCE FL 14 8 X X COCOA BEACH FL 7 4 X X DAYTONA BEACH FL 5 3 X X MARCO ISLAND FL 50 83 99 X CHARLESTON SC X X X X SAVANNAH GA 2 X X X KEY WEST FL 41 37 X X JACKSONVILLE FL 4 3 X X FT MYERS FL 37 67 94 X VENICE FL 26 46 62 X TAMPA FL 16 19 6 X CEDAR KEY FL 10 10 4 X ST MARKS FL 8 8 6 6 APALACHICOLA FL 11 12 9 8 PANAMA CITY FL 10 11 11 10 GULF 29N 85W 13 15 13 9 GULF 29N 87W 14 16 25 23 PENSACOLA FL 10 12 15 16 MOBILE AL 10 12 17 18 MMMD 210N 897W 3 3 X X GULFPORT MS 11 13 19 21 BURAS LA 13 16 24 26 NEW ORLEANS LA 12 14 21 23 NEW IBERIA LA 12 14 20 21 GULF 28N 89W 16 19 33 36 GULF 28N 91W 15 17 26 28 FREEPORT TX 10 11 13 13 PORT O CONNOR TX 10 10 11 10 PORT ARTHUR TX 10 12 16 17 GALVESTON TX 11 12 15 15 MMSO 238N 982W 5 3 X X GULF 28N 93W 13 15 19 19 GULF 28N 95W 11 12 13 13 GULF 27N 96W 10 10 9 8 BROWNSVILLE TX 8 6 4 3 CORPUS CHRISTI TX 9 8 7 6 GULF 25N 96W 9 7 4 4 MMTM 222N 979W 3 X X X MMTX 210N 974W 2 X X X ADVISORY ISSUE TIME: 24/11PM 25/5AM 25/11AM 25/5PM 25/11PM PROBABILITY END TIME: 27/8PM 28/2AM 28/8AM 28/2PM 28/8PM FT PIERCE FL 2 X X X X COCOA BEACH FL 2 X X X X DAYTONA BEACH FL 3 X X X X MARCO ISLAND FL 2 X X X X CHARLESTON SC 2 X X X X SAVANNAH GA 3 X X X X JACKSONVILLE FL 4 X X X X FT MYERS FL 2 X X X X VENICE FL 3 X X X X TAMPA FL 4 X X X X CEDAR KEY FL 6 X X X X ST MARKS FL 9 5 X X 6 APALACHICOLA FL 11 7 6 4 6 PANAMA CITY FL 13 8 7 6 7 GULF 29N 85W 11 6 5 4 5 GULF 29N 87W 21 15 9 6 6 PENSACOLA FL 16 13 11 9 11 MOBILE AL 18 16 14 13 13 GULFPORT MS 20 20 18 16 15 BURAS LA 23 32 50 44 64 NEW ORLEANS LA 21 25 36 37 66 NEW IBERIA LA 19 23 38 50 76 GULF 28N 89W 37 68 99 99 6 GULF 28N 91W 24 40 63 99 99 FREEPORT TX 11 16 17 15 5 PORT O CONNOR TX 9 13 13 10 2 PORT ARTHUR TX 14 18 24 28 30 GALVESTON TX 13 17 20 19 11 MMSO 238N 982W X 3 X X X GULF 28N 93W 17 21 21 22 8 GULF 28N 95W 12 16 14 11 3 GULF 27N 96W 8 12 9 6 X BROWNSVILLE TX 4 7 5 2 X CORPUS CHRISTI TX 6 10 9 6 X GULF 25N 96W 4 7 4 X X |
|---|
![[IMAGE LINK]](gifs/1992andy.JPG)
![[IMAGE LINK]](gifs/1992andy1.gif)
![[IMAGE LINK]](gifs/1992andrad1.gif)
![[IMAGE LINK]](gifs/1992ed_andr2.gif)
![[IMAGE LINK]](gifs/1992and2520.gif)
![[IMAGE LINK]](gifs/1992andrad2.gif)
![[IMAGE LINK]](gifs/1992andrew1.gif)
![[IMAGE LINK]](gifs/1992andrew2.gif)
![[IMAGE LINK]](gifs/1992andrew3.gif)
![[IMAGE LINK]](gifs/1992andrew4.gif)
![[IMAGE LINK]](gifs/1992andrew5.gif)
![[IMAGE LINK]](gifs/1992andrew6.gif)
![[IMAGE LINK]](gifs/1992andrew7.gif)
![[IMAGE LINK]](gifs/1992andrew8.gif)