
This information is also available in an NWS Product Description Document (PDF format).
While storm surge is often the greatest threat to life and property from a landfalling tropical storm or hurricane, there is no watch/warning product to highlight the storm surge hazard. Storm surge flooding has accounted for nearly half of the deaths associated with landfalling tropical cyclones over the past fifty years. To help identify and visualize areas most at risk from life-threatening surge, the National Hurricane Center (NHC) began issuing operationally a storm surge watch/warning graphic beginning in 2017 for tropical cyclones affecting the Gulf and Atlantic coasts of the United States. This graphic is intended to separate the watch/warning for life-threatening storm surge inundation from the previously existing wind watch/warning and serve as a call to action.
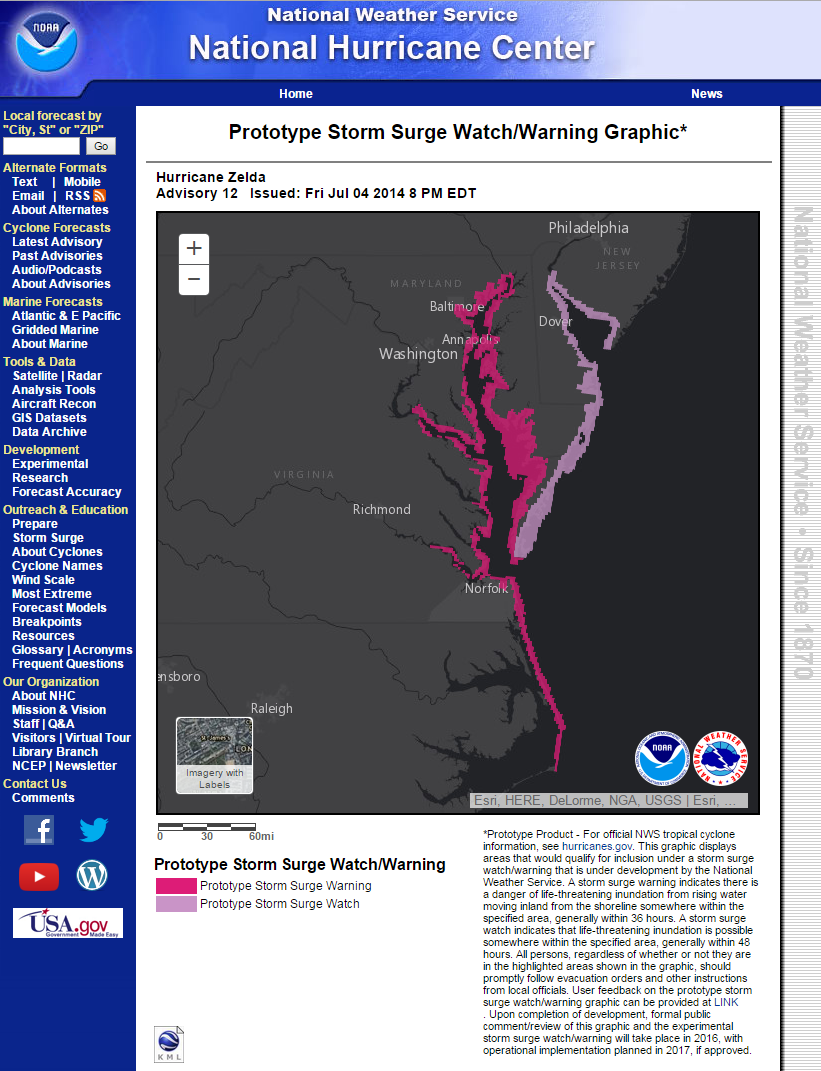
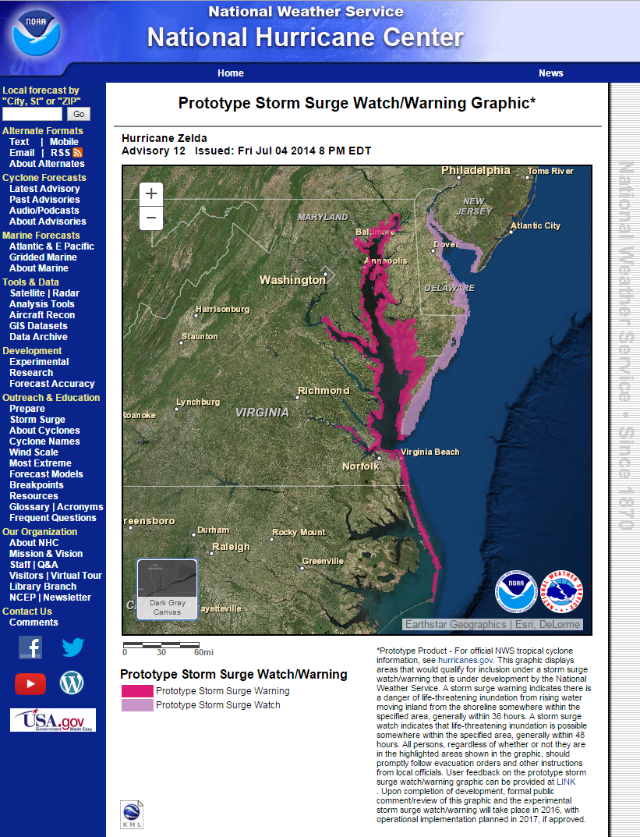
The storm surge watch/warning graphic highlights areas along the Gulf and Atlantic coasts that have a significant risk of life-threatening storm surge inundation from a tropical storm or hurricane, and displays areas that would qualify for inclusion under a storm surge watch/warning under development by the NWS.
The storm surge watches and warnings are represented by different colors, and their individual definitions are below:
A storm surge warning is defined as the danger of life-threatening inundation from rising water moving inland from the shoreline somewhere within the specified area, generally within 36 hours, in association with a tropical, subtropical, or post-tropical cyclone. The warning may be issued earlier when other conditions, such as the onset of tropical storm-force winds, are expected to limit the time available to take protective actions for surge (e.g., evacuations). The warning may also be issued for locations not expected to receive life-threatening inundation, but which could potentially be isolated by inundation in adjacent areas.
A storm surge watch is defined as the possibility of life-threatening inundation from rising water moving inland from the shoreline somwhere within the specified area, generally within 48 hours, in association with a tropical, subtropical, or post-tropical cyclone. The watch may be issued earlier when other conditions, such as the onset of tropical storm-force winds, are expected to limit the time available to take protective actions for surge (e.g., evacuations). The watch may also be issued for locations not expected to receive life-threatening inundation, but which could potentially be isolated by inundation in adjacent areas.
The Potential Storm Surge Flooding Map is based on the forecast track, intensity, and size of a tropical storm or hurricane. Meteorological uncertainty exists in the forecast, and this map incorporates potential forecast errors by using an existing NWS product developed by the NWS Meteorological Development Laboratory (MDL), in cooperation with the NHC, called Probabilistic Hurricane Storm Surge P-Surge 2.5. P-Surge 2.5 is an ensemble model based on the NWS Sea, Lake, and Overland Surges from Hurricanes (SLOSH) model.
The calculation of P-Surge 2.5 is accomplished by statistically evaluating a large set of SLOSH model simulations based on the current NHC official forecast, and taking into account historical errors in the official NHC track and intensity forecasts. P-Surge 2.5 computes the possible storm surge from each of these alternative scenarios using the SLOSH model and combines the results to calculate a statistical distribution of possible storm surge heights at locations along the coast within the next 80 hours. All the major factors that influence the amount of storm surge generated by a storm at a given location are accounted for, including: the hurricane's landfall location; storm intensity, size, forward speed, and angle of approach to the coast; the shape of the coastline; the slope of the ocean bottom; and local features such as barrier islands, bays, and rivers.
The storm surge watch/warning graphic takes into account:
The storm surge watch/warning graphic does not take into account:
The storm surge watch/warning graphic is the result of a collaborative process between the NHC and Weather Forecast Offices (WFOs) and is generated within the Advanced Weather Interactive Processing System II (AWIPS II). Forecaster confidence, continuity from advisory to advisory, and other subjective factors influence the areas highlighted in the storm surge watch/warning graphic.
NHC will release the graphic approximately 48 hours before the possibility of life-threatening storm surge from a tropical cyclone for areas along the Gulf and Atlantic coasts of the United States. The graphic is subject to change every six hours in association with each new NHC full advisory advisory package. The graphic will be available approximately 30 minutes after advisory time (3, 9, 15, and 21 UTC).
The storm surge watch/warning graphic is disseminated during as a KML file.
Note: These are static examples of the storm surge watch/warning graphic. The product itself will be interactive with pan and zoom capability.
|
|
Please feel free to use any of the methods below for submitting comments.