ZCZC HFOTWOCP ALL
TTAA00 PHFO DDHHMM
Tropical Weather Outlook
NWS Central Pacific Hurricane Center Honolulu HI
200 PM HST Tue Aug 18 2020
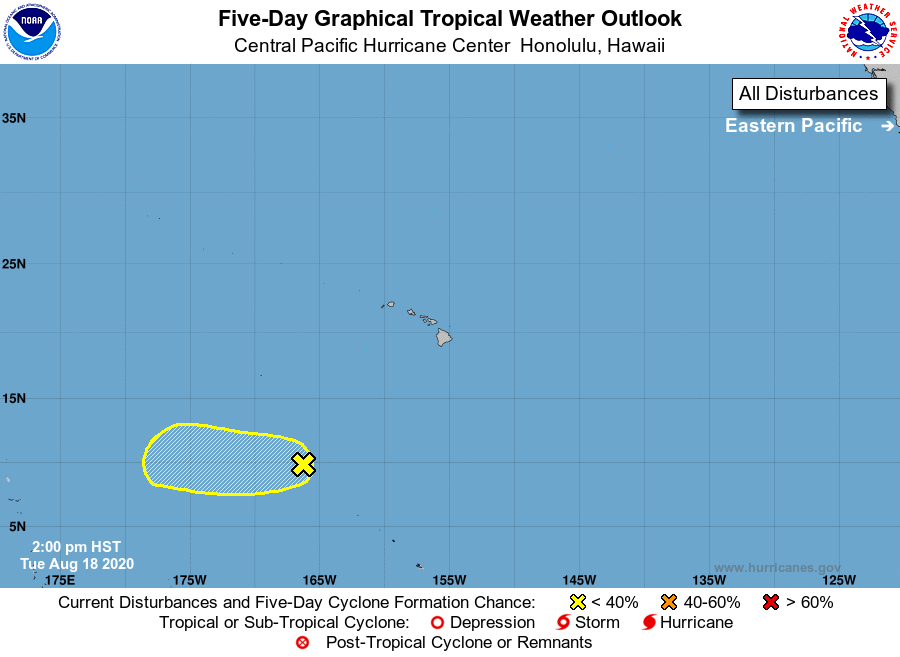
For the central North Pacific...between 140W and 180W:
1. An area of low pressure is about 950 miles southwest of Honolulu,
Hawaii. Most of the showers and thunderstorms have dissipated
over the last several hours, leaving the low level center largely
exposed. Environmental conditions are not expected to be conducive
for development over the next few days, with only a small chance of
development existing as the system continues westward and nears
the Date Line later in the week.
* Formation chance through 48 hours...low...near 0 percent.
* Formation chance through 5 days...low...10 percent.
Elsewhere, no tropical cyclones are expected during the next 5 days.
Forecaster M Ballard