ZCZC HFOTWOCP ALL
TTAA00 PHFO DDHHMM
Tropical Weather Outlook
NWS Central Pacific Hurricane Center Honolulu HI
200 AM HST Fri Sep 13 2019
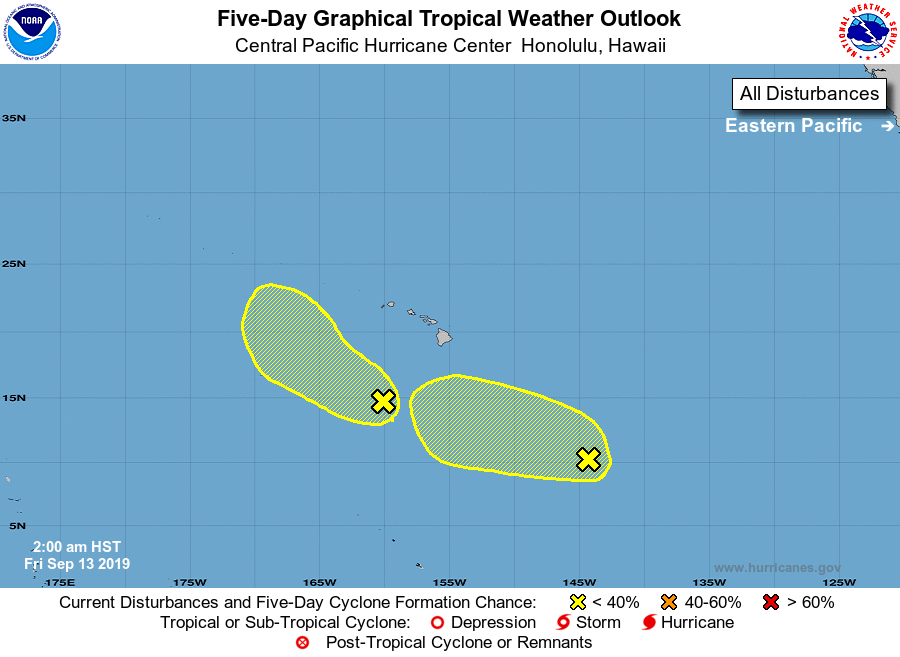
For the central North Pacific...between 140W and 180W:
1. Disorganized showers and thunderstorms centered about 500 miles
south of Honolulu, Hawaii are associated with an area of
low pressure. Some slow development of this disturbance is
possible during the next several days while the system moves slowly
northwestward.
* Formation chance through 48 hours...low...10 percent.
* Formation chance through 5 days...low...20 percent.
2. An area of low pressure is located around 1000 miles southeast of
the Big Island of Hawaii. Some slow development of this disturbance
is possible during the next several days while the system moves
slowly west-northwestward.
* Formation chance through 48 hours...low...10 percent.
* Formation chance through 5 days...low...20 percent.
Elsewhere, no tropical cyclones are expected during the next 5 days.
Forecaster Gibbs