


NHC Marine Product Descriptions
This information is also available in Spanish (esta información también está disponible en español.) (PDF)
| Text Products |
Graphical Products |
Other TAFB Services |
For a quick reference to many of the products listed below, you may download our trifold brochure. (También está disponible en español.)
Tropical Weather Discussion
![[map of Tropical Weather Discussion Area of Responsibility]](/images/tafb_aor_twd.png)
Purpose
The Tropical Weather Discussion describes major synoptic weather features and significant areas of disturbed weather in the tropics. The product is intended to provide current weather information for those who need to know the current state of the atmosphere and expected trends to assist them in their decision making. The product gives significant weather features, areas of disturbed weather, expected trends, the meteorological reasoning behind the forecast, model performance, and in some cases a degree of confidence.
Content
The Tropical Weather Discussion is a narrative explaining the current weather conditions across the tropics and the expected short-term changes. The product is divided into four different sections as outlined below:
- SPECIAL FEATURES (event-driven)
The special features section includes descriptions of hurricanes, tropical storms, tropical depressions, subtropical cyclones, and any other feature of significance that may develop into a tropical or subtropical cyclone. For active tropical cyclones, this section provides the latest advisory data on the system. Associated middle and upper level interactions as well as significant clouds and convection are discussed with each system. This section is omitted if none of these features is present. - TROPICAL WAVES (event-driven)
This section provides a description of the strength, position, and movement of all tropical waves analyzed on the surface analysis, from east to west. A brief reason for a wave's position is usually given, citing surface observations, upper air time sections, satellite imagery, etc. The associated convection is discussed with each tropical wave as well as any potential impacts to landmasses or marine interests. This section is omitted if there are no tropical waves present. - ITCZ
In this section, the Intertropical Convergence Zone (ITCZ) is depicted by coordinates from east to west with an outline of all associated convection referenced to the axis, if possible. The ITCZ is depicted based on the following definition: "a zonally elongated axis of surface wind confluence in the tropics, due to confluence of northeasterly and southeasterly trade winds, and/or confluence at the poleward extent of cross-equatorial flow into a near-equatorial 'heat trough' or 'monsoon trough.'" - DISCUSSION
The discussion section makes reference to middle and upper level features and provides connection to how these features are interacting with or influencing surface features. Convection is outlined with the features as warranted. This section will also provide short-term (up to 48 hours) trends and forecasts of features, especially if they are forecast to strengthen and/or affect landmasses. A discussion of model guidance may also be included. In general, this section is regionalized according to the current weather pattern (i.e. Gulf of Mexico, Caribbean, Western Atlantic, etc.)
Coverage and intensity for convective and non-convective weather is defined as follows:
COVERAGE FOR CONVECTIVE and NON-CONVECTIVE WEATHER:
| Numerous | Widespread | >54% |
| Scattered | Areas | 25% - 54% |
| Widely scattered | Local/Locally | <25% |
| Isolated | No %, implies circumnavigability |
COVERAGE FOR SIGNIFICANT CLOUDS:
| Clear | 0 |
| Few | 1/8 - 2/8 |
| Scattered | 3/8 - 4/8 |
| Broken | 5/8 - 7/8 |
| Overcast | 8/8 |
INTENSITY OF CONVECTION (based on cloud top temperatures):
| Strong | < -70°C (summer) | < -60°C (winter) |
| Moderate | between -45°C and -70°C (summer) | between -35°C and -60°C (winter) |
| Weak | > -45°C (summer) | > -35°C (winter) |
Coverage
The National Hurricane Center issues two Tropical Weather Discussions, as shown below:
- Atlantic
From the equator to 32°N west of the prime meridian including the Caribbean Sea, Gulf of Mexico, and adjacent land areas. These areas include the southeast United States [especially Florida], Mexico, Central America, northern South America, and western Africa - East Pacific
From the equator to 32°N east of 140°W including coastal areas of Mexico, and Central and South America.
Issuance/Transmission
| WMO | NWWS | |
|---|---|---|
| Atlantic | AXNT20 KNHC | MIATWDAT |
| East Pacific | AXPZ20 KNHC | MIATWDEP |
| Issuance Time | |||||
| MIATWDAT | 105 AM EST (205 AM EDT) |
705 AM EST (805 AM EDT) |
105 PM EST (205 PM EDT) |
705 PM EST 805 PM EDT) |
|
|---|---|---|---|---|---|
| MIATWDEP | 0405 UTC | 1005 UTC | 1605 UTC | 2205 UTC | |
High Seas Forecasts
![[map of High Seas Forecast Area of Responsibility]](/images/tafb_aor_hsf.png)
Purpose
The world's oceans and seas are divided up into 16 separate regions known as "METAREAS" with different nations having responsibility for providing high seas marine forecasts for those waters. These high seas forecasts are used mainly by large transoceanic vessels but can also be used by smaller vessels or those on shorter voyages. The U.S. National Weather Service (through the National Hurricane Center, the Ocean Prediction Center, and the Honolulu Weather Forecast Office) has the responsibility to provide high seas marine forecasts for METAREAS IV and XII, which cover most of the North Atlantic Ocean and North Pacific Ocean. On June 30, 2017, NHC transferred forecast responsibility for the Southeast Pacific Ocean (METAREA XVI) to Peru. These forecasts can be found at https://www.dhn.mil.pe/metareaoceanica and https://www.dhn.mil.pe/metareacostera. NHC will retain forecast backup resonsibility for the Southeast Pacific high seas forecast (HSFEP3) in the event Peru is unable to compose and transmit the product.
Content
The National Hurricane Center issues three High Seas Forecasts for parts of METAREAS IV and XII. Each product is updated every 6 hours and includes a description of winds and waves for the current time (a nowcast) and a 24- and 48- hour forecast of the winds and waves, using a 20 knot threshold for the wind and an 8 feet threshold for the seas. Positions and intensities are also given for tropical cyclones out to the 120-hour forecast. Intermediate forecast times are given for rapidly changing weather events. The High Seas products also include updated descriptions of convection, particularly along the ITCZ. The products include marine warnings for gale, storm, hurricane force winds, and tropical cyclone-related conditions and can also include information on reduced visibility and other marine hazards.
Coverage
- Atlantic Ocean (from 7°N to 31°N west of 35°W, including the Caribbean Sea and the Gulf of Mexico)
- Northeast Pacific Ocean (from Equator to 30°N east of 140°W and from Equator to 3.4°S east of 120°W)
Issuance/Transmission
High seas products are transmitted under World Meteorological Organization (WMO) and NOAA Weather Wire Service (NWWS) headers as shown in the following table (alternate headers are for high seas products issued by the Ocean Prediction Center, which append the forecasts of the National Hurricane Center):
| Primary Headers | Alternate Headers | |||
|---|---|---|---|---|
| WMO | NWWS | WMO | NWWS | |
| Atlantic | FZNT02 KNHC | MIAHSFAT2 | FZNT01 KWBC | NFDHSFAT1 |
| Northeast Pacific | FZPN03 KNHC | MIAHSFEP2 | FZPN01 KWBC | NFDHSFEPI |
| Southeast Pacific (Backup) | FZPN04 KNHC | MIAHSFEP3 | (WMO Peru) FQPR01 SPIM | |
High seas products are issued on a regular six hourly schedule as shown below:
| Issuance Time in UTC | ||||
|---|---|---|---|---|
| MIAHSFAT2 | 0430 | 1030 | 1630 | 2230 |
| MIAHSFEP2 | 0430 | 1030 | 1630 | 2230 |
| MIAHSFEP3 (Backup) | 0515 | 1115 | 1715 | 2315 |
Alternate headers for the Atlantic and Northeast Pacific Forecasts are where TAFB forecasts are appended to High Seas Forecasts of the Ocean Prediction Center. In addition, Atlantic high seas products are transmitted by radiofax.
See table for the latest High Seas ForecastOffshore Waters Forecasts
Purpose
The Tropical Analysis and Forecast Branch (TAFB) of the National Hurricane Center (NHC) provides forecast and warning information to mariners who travel on the oceanic waters adjacent to the U.S. and its territorial coastal waters in the Gulf of Mexico, Caribbean Sea, and portions of the tropical and subtropical North Atlantic Ocean. The primary alphanumeric product issued by the NHC/TAFB for this purpose is the Offshore Waters Forecast, serving users who operate from the coastal waters out several hundred nautical miles from shore. The Offshore Waters Forecast complements the higher resolution Coastal Waters Forecast produced by local National Weather Service forecast offices and cover the U.S. territorial waters from the coast out to 60 nm offshore.
Content
The Offshore Waters Forecasts cover the Gulf of Mexico, Caribbean Sea, and portions of the Atlantic Ocean south of 31�North and west of 55� West. This area is divided into 32 zones designed in part to take into account the regional marine climatology. The configuration of the Offshore Waters Marine zones is shown on the map below:
![[map of Offshore Zones Forecast areas of responsibility]](/images/tafb_aor_off.png)
Coverage
There are three Offshore Waters Forecast provided by the NHC/TAFB. The MIAOFFNT3 (WMO header FZNT23 KNHC) covers the Caribbean Sea, and the Tropical North Atlantic south of 19° North. The MIAOFFNT4 (WMO header FZNT24 KNHC) encompasses the Gulf of Mexico. The MIAOFFNT5 (WMO header FZNT25 KNHC) covers the Southwest North Atlantic north of 19° North.
These Offshore Waters Forecasts provide mariners with a general overview of large scale environmental marine conditions out five days, to include winds, seas, and major weather impacts. Marine warnings such as gale warnings or warnings for tropical storms or hurricanes will be headlined for each affected zone through the first 36 hours of the forecast period. In addition, brief, plain-language synopses are included in the forecast for the Gulf of Mexico, the Caribbean Sea and Tropical Atlantic, and the Southwest North Atlantic areas.
Winds represent predominant conditions at 10 meters above the surface of the water. Wind direction is described by the eight points of the compass.
Sea state is described in terms of "significant wave height" which is defined in the NWS Glossary as .the mean or average height of the highest one third of all waves in a swell train or in a wave generating region. It approximates the value an experienced observer would report if visually estimating sea height.. Seas will typically be expressed in terms of a range (e.g. 2 to 4 ft). This is to represent uncertainty in the forecast, especially considering the large areas of each marine zone. In fact, it is important to emphasize that there is a broad spectrum of wave heights at any given time in any part of the ocean, and individual wave heights may be twice the significant wave height. In addition to significant wave height, dominant swell and direction are described as needed.
The Offshore Waters Forecast also includes weather impacts whenever they are expected to pose a danger to navigation. This may be in the form of widespread areas of fog, smoke, or volcanic ash that limit visibility, or large clusters of moderate to strong thunderstorms.
Marine Zone Names and Universal Geographic Codes (UGC's)
Although not technically marine zones, the Synopsis paragraphs also have assigned UGC's as shown below:
Synopses
| UGC | Synopsis Name |
|---|---|
| AMZ001 |
Synopsis for the Caribbean and Tropical N Atlantic from 07N to 19N between 55W and 64W |
| AMZ101 |
Synopsis for the SW N Atlantic including the Bahamas |
| GMZ001 |
Synopsis for the Gulf of Mexico |
Issuance/Transmission
Offshore waters products are transmitted under World Meteorological Organization (WMO) and NOAA Weather Wire Services (NWWS) headers as shown in the following table:
| WMO | NWWS | |
|---|---|---|
| Caribbean Sea and Tropical North Atlantic |
FZNT23 KNHC | MIAOFFNT3 |
| Gulf of Mexico Forecast | FZNT24 KNHC | MIAOFFNT4 |
| Southwest North Atlantic | FZNT25 KNHC | MIAOFFNT5 |
Offshore waters products are issued on a regular six hourly schedule as shown below:
| Issuance Time | |||||
|---|---|---|---|---|---|
| MIAOFFNT3 MIAOFFNT4 MIAOFFNT5 |
430 AM EST (530 AM EDT) 430 AM EDT |
1030 AM EST (1130 AM EDT) 1030 AM EDT |
430 PM EST (530 PM EDT) 430 PM EDT |
1030 PM EST (1130 PM EDT) 1030 PM EDT |
|
NAVTEX (Navigational Telex) Marine Forecasts
Purpose
The International Maritime Organization has designated NAVTEX as the primary means for transmitting coastal urgent marine safety information to ships worldwide. In the United States, NAVTEX is broadcast from Coast Guard facilities in Cape Cod, MA; Chesapeake, VA; Savannah, GA; Miami, FL; New Orleans, LA; San Juan, PR; Cambria, CA; Pt. Reyes, CA; Astoria, OR; Kodiak, AK; Honolulu, HI and Guam. The Coast Guard began operating NAVTEX from Boston in 1983.
NAVTEX coverage is reasonably continuous along the east, west and Gulf coasts of the United States, as well the area around Kodiak, Alaska; Guam and Puerto Rico. The U.S. has no coverage in the Great Lakes, though coverage of much of the Lakes is provided by the Canadian Coast Guard.
Content
NHC/TAFB is responsible for producing three NAVTEX forecasts transmitted from New Orleans, Miami, and San Juan. The broadcast includes a synopsis which describes surface weather features that may cause significant winds and seas over the forecast area during the forecast period. The synopsis identifies major weather systems and the strength, trend, and movement of each system. The most detail is focused in the first 48 hours of the forecast. The synopsis also includes tropical cyclone forecast positions out to 120 hours.
The NAVTEX provides a forecast for winds and seas over the affected area for roughly the next 5 days. The forecast also includes significant weather which would pose a hazard to navigation, such as precipitation or restrictions to visibility. Warnings are issued when conditions are expected to meet the specific warning criteria during the 36 hours of the forecast.
NAVTEX forecasts are similar to the Offshore Waters Forecasts, but differ in some in important aspects. Since the NAVTEX zones were designed to accommodate the listening area of their respective transmitters, they are configured differently than the more comprehensive Offshore Waters Forecast zones. The content of both forecasts relates to the same weather elements, covering similar areas, over the same times. However, the NAVTEX forecast differ from the Offshore Waters Forecast in that the NAVTEX zones include coastal areas within 60 nm of the shore, whereas the Offshore Waters Forecasts do not. NAVTEX forecast are required to be less than 89 lines, sometimes limiting the amount of detail that can be included. While Offshore Waters Forecasts are concise, there is no similar limitation to text length. Thus, NAVTEX forecast tend to be of a lower resolution than the Offshore Waters Forecasts. This can result in slight difference in wording between the two products. Warning information will be exactly the same for each forecast, however.
Coverage
Each of the three NAVTEX forecasts produced by NHC/TAFB are described below, along with a map displaying each forecast area: TAFB issues three separate NAVTEX Forecasts, as shown below with the following AWIPS/WMO headers:
| Transmitter | Product Identifiers | Description of Area |
|---|---|---|
| Miami, FL | FZNT25 KNHC, MIAOFFN04 | Flagler Beach, FL to Suwanne River, FL out 200 nm |
| San Juan, PR | FZNT26 KNHC, MIAOFFN05 | 200 nm surrounding San Juan, PR |
| New Orleans, LA | FZNT27 KNHC, MIAOFFN06 | Suwanee River, FL to Rio Grande out 200 nm |
![[map of NAVTEX Area of Responsibility]](/images/tafb_aor_navtex.png)
Issuance/Transmission
NAVTEX is an international automated medium frequency (518 kHz) direct-printing service for delivery of navigational and meteorological warnings and forecasts, as well as urgent marine safety information to ships. It was developed to provide a low-cost, simple, and automated means of receiving this information aboard ships at sea within approximately 200 nautical miles of shore. NAVTEX stations in the U.S. are operated by the U.S. Coast Guard. There are no user fees associated with receiving NAVTEX broadcasts. Within the U.S., there are no current plans to broadcast NAVTEX on the alternate designated frequencies of 490 or 4209.5 kHz.
NAVTEX is a major element of the Global Marine and Distress Safety System (GMDSS). For further information on NAVTEX, the GMDSS, and worldwide NAVTEX schedules, including coverage diagrams, visit the U.S. Coast Guard Maritime Telecommunications Information webpage. Daily issuance times (in UTC) for each broadcast are 0345, 0945, 1545, and 2145.
See table for the latest NAVTEX Marine ForecastsHigh Frequency (HF) Voice Broadcasts - VOBRA
![[map of VOBRA Area of Responsibility]](/images/tafb_aor_vobra.png)
Purpose
The U.S. Coast Guard provides basic weather information from the National Weather Service in the form of routine High Frequency voice broadcasts (also known as "VOBRA") in order to provide service to vessels operating in areas beyond the range of coastal NOAA Weather Radio stations. This information is prepared cooperatively by the Ocean Prediction Center, National Hurricane Center and Honolulu Forecast Office.
Content
There are three Offshore Waters Forecast provided by the NHC/TAFB. The MIAOFFNT3 (WMO header FZNT23 KNHC) covers the Caribbean Sea, and the Tropical North Atlantic south of 19° North. The MIAOFFNT4 (WMO header FZNT24 KNHC) encompasses the Gulf of Mexico. The MIAOFFNT5 (WMO header FZNT25 KNHC) covers the Southwest North Atlantic north of 19° North.
The two VOBRA forecasts provide mariners with a general overview of large scale environmental marine conditions out five days, to include winds, seas, and major weather impacts. Marine warnings such as gale warnings or warnings for tropical storms or hurricanes will be headlined for each affected zone through the first 36 hours of the forecast period. In addition, brief, plain-language synopses are included in the forecast for the Gulf of Mexico, the Caribbean Sea and Tropical Atlantic, and the Southwest North Atlantic areas.
Winds represent predominant conditions at 10 meters above the surface of the water. Wind direction is described by the eight points of the compass.
Sea state is described in terms of .significant wave height. which is defined in the NWS Glossary as .the mean or average height of the highest one third of all waves in a swell train or in a wave generating region. It approximates the value an experienced observer would report if visually estimating sea height.. Seas will typically be expressed in terms of a range (e.g. 2 to 4 ft). This is to represent uncertainty in the forecast, especially considering the large areas of each marine zone. In fact, it is important to emphasize that there is a broad spectrum of wave heights at any given time in any part of the ocean, and individual wave heights may be twice the significant wave height. Unlike the Offshore Waters Forecasts, the VOBRA forecasts do not include swell information. This is due the limited broadcast times available.
The VOBRA forecasts also include weather impacts whenever they are expected to pose a danger to navigation. This may be in the form of widespread areas of fog, smoke, or volcanic ash that limit visibility, or large clusters of moderate to strong thunderstorms.
Coverage
TAFB issues two VOBRA text forecasts, as shown below with the following AWIPS/WMO headers:
AWIPS/WMO Identifiers
| Identifiers | Description of Area |
|---|---|
| FZNT31 KNHC/MIAOFFN20 | Caribbean Sea and portions of the Western Atlantic Ocean South of 31° North |
| FZNT32 KNHC/MIAOFFN21 | Gulf of Mexico |
AWIPS Header MIAOFFN20 - WMO Header FZNT31 KNHC
Area of coverage: Caribbean Sea, Southwest North Atlantic (south of 31�North and west of 65� West) and the Tropical North Atlantic (from 07�North to 19�North west of 55�West) and includes the following combination of the offshore waters zones in the Caribbean Sea and Tropical North Atlantic Ocean
- NW Caribbean W of 85W
- Caribbean N of 15N between 72W and 85W
- Caribbean from 11N to 15N W of 70W
- SW Caribbean S of 11N
- Caribbean between 64W and 72W
- Offshore Leeward Islands and adjacent Atlantic waters from 15N to 19N W of 55W
- Offshore Windward Islands and adjacent Atlantic waters from 07N to 15N W of 55W
and the southwest North Atlantic
- Atlantic waters from 27N to 31N W of 77W
- Atlantic waters from 27N to 31N between 65W and 77W
- Bahamas N of 22N
- Atlantic waters from 22N to 27N between 65W and the Bahamas
- Atlantic waters S of 22N W of 65W
- Atlantic waters from 19N to 22N between 55W and 65W
![[map of VOBRA Atlantic/Caribbean Area of Responsibility]](/images/tafb_aor_vobra3.png)
Combination of offshore zones for the MIAOFFN20 VOBRA text product.
AWIPS Header MIAOFFN21 - WMO Header FZNT32 KNHC
Area of coverage: Gulf of Mexico and includes the following combination of the offshore waters zones in the Gulf of Mexico Portions of Offshore Waters Forecasts parsed into the Broadcast:
- Gulf of Mexico N of 26N W of 87W
- Gulf of Mexico from 22N to 26N W of 87W
- Gulf of Mexico S of 22N W of 87W
- Gulf of Mexico E of 87W
![[map of VOBRA Gulf of Mexico Area of Responsibility]](/images/tafb_aor_vobra4.png)
Combination of offshore zones for the MIAOFFN21 VOBRA text product.
Issuance/Transmission
The transmissions originate from six sites located around the country and the transmission range is dependent upon operating frequency, time of day and atmospheric conditions and can vary from only short distances to several thousand miles. Best reception can be achieved by proper selection of frequency and an adequate antenna system. HF Voice Broadcasts covering TAFB's marine area of responsibility are conducted by the USCG from transmitter sites in Chesapeake, VA, and (New Orleans) Belle Chase, LA. See table below for station broadcast schedules.
HF Voice Broadcast Schedule
Zone forecast broadcast times indicated by orange shading. High Seas forecast broadcast times indicated by unshaded times.
Chesapeake (NMN)
| Frequency | Time (UTC) | |||||||
|---|---|---|---|---|---|---|---|---|
| 4426, 6501, 8764 kHz (USB) | 0330 | 0515 | 0930 | |||||
| 6501, 8764, 13089 kHz (USB) | 1115 | 1530 | 2130 | 2315 | ||||
| 8764, 13089, 17314 kHz (USB) | 1715 | |||||||
New Orleans (NMG)
| Frequency | Time (UTC) | |||||||
|---|---|---|---|---|---|---|---|---|
| 4316, 8502, 12788 kHz (USB) | 0330 | 0515 | 0930 | 1115 | 1530 | 1715 | 2130 | 2315 |
See table for the latest HF Voice Broadcasts
Pan-American Temperature and Precipitation Table
![[map of Pan American Temperature and Precipitation Table Stations]](/images/tafb_aor_tptpan.png)
Purpose
The Pan-American Temperature and Precipitation Table is a collection of temperature and precipitation data and present weather for selected cities in Mexico, Central and South America, and the Caribbean area. It provides general weather conditions two times per day for general public use domestically and internationally.
Content
This product provides general weather conditions, high and low temperatures in degrees Fahrenheit (°F) and degrees Celsius (°C), and measured precipitation in the previous 6, 12, or 24 hours, as indicated, for selected cities in Mexico, Central and South America, and the Caribbean area. The morning product contains the low temperature for the current day and the high temperature for the previous day. The evening product contains the low and high temperature for the current day.
Coverage
The Pan-American Temperature and Precipitation Table includes the following stations (as shown in the map above):
| Acapulco, Mexio | Merida, Mexico |
| Barbados | Mexico City, Mexico |
| Bermuda | Montego Bay, Jamaica |
| Bogotá, Colombia | Monterrey, Mexico |
| Curaçao, Netherlands Antilles | Nassau, Bahamas |
| Freeport, Bahamas | San Juan, Puerto Rico |
| Guadalajara, Mexico | St. Thomas, Virgin Islands |
| Guadeloupe | Tegucigalpa, Honduras |
| Havana, Cuba | Trinidad |
| Kingston, Jamaica | Veracruz, Mexico |
| Mazatlán, Mexico |
Issuance/Transmission
The Pan-American Temperature and Precipitation Table is transmitted under World Meteorological Organization (WMO) and NOAA Weather Wire Services (NWWS) headers as shown below:
| WMO | NWWS | |
| Pan-Am Table | SXCA01 KNHC | MIATPTPAN |
| Valid Time | Issuance Time | |
| Morning MIATPTPAN | 700 AM EST (800 AM EDT) |
by 950 AM EST (1050 AM EDT) |
| Evening MIATPTPAN | 700 PM EST (800 PM EDT) |
by 950 PM EST (1050 PM EDT) |
Tropical Surface Analysis / NWS Unified Surface Analysis
Purpose
The Tropical Surface Analysis is created every six hours to depict the current state of atmosphere, specifically the sea level pressure field and any relevant synoptic surface features. The Tropical Surface Analysis is attached to surface analyses over North America, the North Atlantic Ocean, the North Pacific Ocean, and the Western Pacific Ocean to create the National Weather Service Unified Surface Analysis.
Content
The Tropical Surface Analysis and NWS Unified Surface Analysis depict the sea level pressure field by showing lines of equal pressure, usually in increments of four millibars (mb) but often in increments of two millibars where the pressure gradient is weaker (especially in the tropics). The analysis also depicts important surface features that affect the weather, including areas of high and low pressure, frontal systems (cold, warm, stationary, and occluded), troughs, tropical cyclones, tropical waves, the Intertropical Convergence Zone (ITCZ), drylines, and squall lines.
Coverage
The Tropical Surface Analysis is created by the National Hurricane Center and covers the area approximately from 30°N to 20°S between 0° and 140°W. This area includes the tropical and subtropical areas of the Atlantic and East Pacific Oceans, Mexico, Florida, the Caribbean, South America, and West Africa. For radiofax purposes, the analysis is split into three different areas:
- Atlantic (East Half from 5°S to 50°N between 0° and 70°W)
- Atlantic (West Half from 5°S to 50°N between 55°W and 125°W)
- Eastern Pacific (from 20°S to 40°N between 70°W and 150°W)
The NWS Unified Surface Analysis is created by merging the separate surface analysis produced by the National Hurricane Center, the Weather Prediction Center, the Ocean Prediction Center, and the Honolulu Weather Forecast Office. The total area spans from the equator northward nearly to the North Pole, from 20°E westward to 130°W. This covers the area from Europe and Central Africa westward across North and South America to East Asia.
Issuance/Transmission
The Tropical Surface Analysis is transmitted by radiofax via New Orleans, Pt. Reyes, and Honolulu according to the following table:
| New Orleans, LA (East Half) |
New Orleans, LA (West Half) |
Pt. Reyes, CA | Honolulu, HI | |||||
|---|---|---|---|---|---|---|---|---|
| Valid Time (UTC) |
Transmit Time (UTC) |
Filename | Transmit Time (UTC) |
Filename | Transmit Time (UTC) |
Filename | Transmit Time (UTC) |
Filename |
| 0000 | 0620 | PYEA86.TIF | 0605 | PYEB86.TIF | 0408 | PYFA96.TIF | 0356 | PYFA96.TIF |
| 0600 | 1220 | PYEA87.TIF | 1205 | PYEB87.TIF | 0945 | PYFA97.TIF | 0954 | PYFA97.TIF |
| 1200 | 1820 | PYEA85.TIF | 1805 | PYEB85.TIF | 1608 | PYFA98.TIF | 1556 | PYFA98.TIF |
| 1800 | 0020 | PYEA88.TIF | 0005 | PYEB88.TIF | 2150 | PYFA99.TIF | 2154 | PYFA99.TIF |
| latest | PYEA11.TIF | PYEB11.TIF | PYFA90.TIF | PYFA90.TIF | ||||
The analyses are also updated on the NHC webpage by 0300, 0900, 1500, and 2100 UTC for the 0000, 0600, 1200, and 1800 UTC surface analyses, respectively.
See table for the latest Tropical Surface AnalysisSignificant Wave Height Analysis
Purpose
The Significant Wave Height Analysis is created every 12 hours, at 0000 and 1200 UTC, to depict the current significant wave height and primary swell direction field over the tropical and subtropical Atlantic and East Pacific waters.Content
The significant wave height is contoured at intervals of three feet, with additional contours added if necessary in areas of little spatial variation. The significant wave height is defined as the average height of the highest 1/3 of the waves (individual waves may be more than twice the significant wave height). Maximum and minimum significant wave height values are indicated as necessary. Arrows are also depicted showing the primary swell direction at specific points.
Coverage
The National Hurricane Center produces two separate significant wave height analyses twice a day:
- Atlantic (from the equator to 31°N between 35°W and 100°W, including the Pacific east of 100°W)
- East Pacific (from 20°S to 30°N east of 145°W)
Issuance/Transmission
| New Orleans, LA | Pt. Reyes, CA | Honolulu, HI | ||||
|---|---|---|---|---|---|---|
| Valid Time (UTC) |
Transmission Time (UTC) |
Filename | Transmission Time (UTC) |
Filename | Transmission Time (UTC) |
Filename |
| 0000 | 0215 | PJEA88.TIF | 0205 | PKFA88.TIF | 0240 | PKFA88.TIF |
| 1200 | 1415 | PJEA90.TIF | 1425 | PKFA89.TIF | 1440 | PKFA89.TIF |
| latest | PJEA11.TIF | PKFA10.TIF | PKFA10.TIF | |||
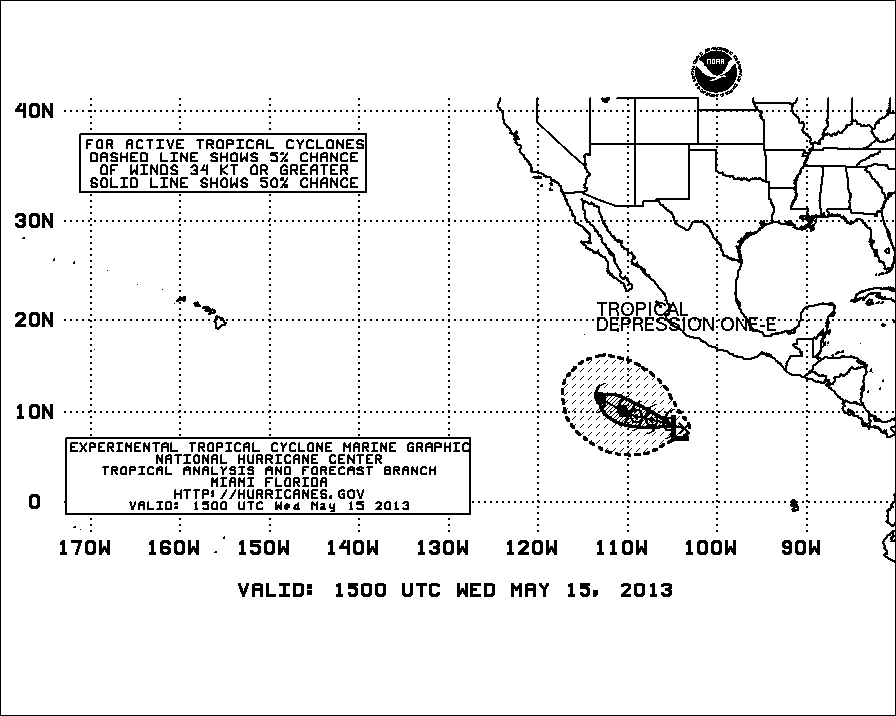
Wind Speed Probabilities-Based Tropical Cyclone Danger Graphic
Purpose
The tropical cyclone danger graphic is intended to depict the forecast track and corresponding area of avoidance for all active tropical cyclones for the next 72 hours over the Atlantic and East Pacific waters between May 15 and November 30.
Content
The tropical cyclone danger area graphic depicts avoidance areas for mariners out through 72 hours. The avoidance areas are based on the 5% and 50% 34-kt wind speed probability contours from the latest tropical cyclone advisory. The avoidance area encompassed by the 5% 34-kt wind speed probability swath conveys a low to medium risk of experiencing tropical storm force winds within the area and is denoted within a dashed line while the 50% 34-kt wind speed probability swath conveys a high risk of experiencing tropical storm force winds and is denoted within a solid line.
In the event there are no active tropical cyclones in either basin, the graphic will be blank with the following wording THERE IS NO TROPICAL CYCLONE ACTIVITY IN THE ATLANTIC for the Atlantic charts and THERE IS NO TROPICAL CYCLONE ACTIVITY IN THE EAST PACIFIC for the East pacific charts.
Coverage
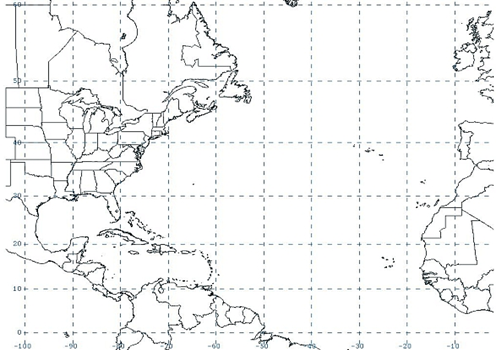 Figure 1. Bounds of the tropical cyclone graphic for the Atlantic basin.
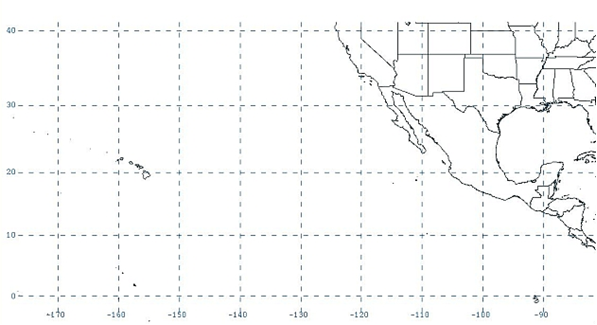 Figure 2. Bounds of the tropical cyclone graphic for the East Pacific basin.
Issuance/Transmission
The tropical cyclone danger graphics are transmitted by radiofax via Boston, New Orleans, and Pt. Reyes according to the following table:
| Boston, MA (Atlantic) |
New Orleans, LA (Atlantic) |
Pt. Reyes, CA (East Pacific) |
||||
|---|---|---|---|---|---|---|
| Valid Time (UTC) | Transmission Time (UTC) | Filename | Transmission Time (UTC) | Filename | Transmission Time (UTC) | Filename |
| 0300 | 0452 | PWEK89.TIF | 0735 | PWEK89.TIF | 0357 | PWFK88.TIF |
| 0900 | 1028 | PWEK90.TIF | 1335 | PWEK90.TIF | 1009 | PWFK89.TIF |
| 1500 | 1824 | PWEK91.TIF | 1935 | PWEK91.TIF | 1557 | PWFK90.TIF |
| 2100 | 2228 | PWEK88.TIF | 0135 | PWEK88.TIF | 2214 | PWFK91.TIF |
| latest | PWEK11.TIF | PWEK11.TIF | PWFK11.TIF | |||
High Wind and Associated Seas
![[example of East Pacific High Wind and Associated Seas Forecast]](/gifs/highwind_epac.gif)
![[example of Atlantic High Wind and Associated Seas Forecast]](/gifs/highwind_atl.gif)
Purpose
The high wind and associated seas graphic is produced by the National Hurricane Center to depict areas of high winds and related seas over the Atlantic and East Pacific waters between December 1 and May 14 (outside of hurricane season).
Content
Areas depicted on the high wind and seas graphic are extracted from the high seas forecasts produced by the National Hurricane Center, the Ocean Prediction Center, and the Honolulu Weather Forecast Office. South of 30°N, areas are depicted for winds higher than 25 knots with the corresponding seas noted. North of 30°N, areas are depicted for winds of gale force (34 knots) or higher with the corresponding seas noted. Ranges in which the 25/34 knot thresholds are the upper limit (i.e. 25-35 knots) are included on the graphic.
Coverage
The National Hurricane Center produces high wind and seas charts covering the following areas:
- Atlantic (from the equator to 40°N between 35°W and 100°W, including the Pacific east of 100°W)
- East Pacific (from the equator to 40°N between 80°W and 150°W)
Issuance/Transmission
The high wind and associated seas graphics are transmitted by radiofax via Boston, New Orleans, and Pt. Reyes according to the following table:
| New Orleans, LA | Pt. Reyes, CA | Honolulu, HI | ||||
|---|---|---|---|---|---|---|
| Valid Time(UTC) |
Transmission Time (UTC) |
Filename | Transmission Time (UTC) |
Filename | Transmission Time (UTC) |
Filename |
| 0000 | 0452 | PWEK89.TIF | 0735 | PWEK89.TIF | 0357 | PWFK88.TIF |
| 0600 | 1028 | PWEK90.TIF | 1335 | PWEK90.TIF | 1009 | PWFK89.TIF |
| 1200 | 1824 | PWEK91.TIF | 1935 | PWEK91.TIF | 1557 | PWFK90.TIF |
| 1800 | 2228 | PWEK88.TIF | 0135 | PWEK88.TIF | 2214 | PWFK91.TIF |
| latest | PWEK11.TIF | PWEK11.TIF | PWFK11.TIF | |||
Wind/Wave Forecasts
![[small image of East Pacific wind/wave forecast]](/gifs/windwave_epac.gif)
![[small image of Atlantic wind/wave forecast]](/gifs/windwave_atl.gif)
Purpose
Wind/wave forecasts are produced to depict the 24-, 48-, and 72-hour forecasts of surface wind speed and direction, and significant wave heights over the tropical and subtropical Atlantic and East Pacific waters.
Content
The wind/wave forecasts include wind barbs that indicate the forecast wind speed and direction at specific points where long barbs indicate 10 knots and short barbs indicate 5 knots. The significant wave height is contoured at intervals of four feet, beginning with eight feet, with additional contours added if necessary in areas of little spatial variation. The significant wave height is defined as the average height of the highest 1/3 of the waves (individual waves may be more than twice the significant wave height). Maximum and minimum significant wave height values are indicated as necessary. Tropical cyclones are also depicted on the graphic.
Coverage
The National Hurricane Center produces wind/wave forecasts covering the following areas:
- Atlantic (from the equator to 31°°N between 35°W and 100°W, including the Pacific east of 100°W)
- East Pacific (from 20°S to 30°N east of 145°W)
Issuance/Transmission
The Wind/wave forecasts are transmitted by radiofax via New Orleans, Pt. Reyes, and Honolulu according to the following table:
| New Orleans, LA (Atlantic) |
Pt. Reyes, CA (East Pacific) |
Honolulu, HI (East Pacific) |
|||||
|---|---|---|---|---|---|---|---|
| Forecast Period |
Valid Time (UTC) |
Transmission Time (UTC) |
Filename | Transmission Time (UTC) |
Filename | Transmission Time (UTC) |
Filename |
| 24-hour | 0000 | 0635 | PWEE89.TIF | 0959 | PWFE01.TIF | 1008 | PWFE01.TIF |
| 1200 | 1835 | PWEE91.TIF | 2204 | PWFE03.TIF | 2208 | PWFE03.TIF | |
| latest | PWEE11.TIF | PWFE10.TIF | PWFE10.TIF | ||||
| 36-hour | 1200 | 1350 | PWED98.TIF | - | - | - | - |
| 48-hour | 0000 | 0645 | PWEI88.TIF | 1208 | PWFI88.TIF | 1500 | PWFI88.TIF |
| 1200 | 1845 | PWEI89.TIF | 0225 | PWFI90.TIF | 0300 | PWFI90.TIF | |
| latest | PWEI11.TIF | PWFI10.TIF | PWFI10.TIF | ||||
| 72-hour | 0000 | 0655 | PJEK88.TIF | 1218 | PWFK92.TIF | 1510 | PWFK92.TIF |
| 1200 | 1855 | PJEK89.TIF | 0235 | PWFK93.TIF | 0310 | PWFK93.TIF | |
| latest | PJEK11.TIF | PWFK10.TIF | PWFK10.TIF | ||||
Surface Forecasts
![[Image of Surface Forecast Area for East Pacific]](/gifs/surface_fcst_epac.gif)
![[Image of Surface Forecast Area for East Pacific]](/gifs/surface_fcst_atl.gif)
Purpose
Surface forecasts are produced to depict the 24-, 48-, and 72-hour forecasts of sea level pressure and surface features over the tropical and subtropical Atlantic and East Pacific waters.
Content
The surface forecasts include the forecast sea level pressure field depicted by isobars contoured every four millibars (mb). Intermediate two millibar isobars are sometimes included in areas where the pressure gradient is relatively light. Relevant surface features are also shown, including areas of high and low pressure, frontal systems (cold, warm, stationary, and occluded), troughs, ridges, drylines, tropical waves, and tropical cyclones. The 72-hour forecast chart also includes a depiction of the 96-hour forecast positions of highs, lows, and tropical cyclones.
Coverage
The National Hurricane Center produces surface forecasts covering the following areas:
- Atlantic (from the equator to 31°N between 35°W and 100°W, including the Pacific east of 100°W)
- East Pacific (from 20°S to 30°N east of 145°W)
Issuance/Transmission
The surface forecasts are transmitted by radiofax via New Orleans and Honolulu according to the following table:
| New Orleans, LA (Atlantic) |
Honolulu, HI (East Pacific) |
Pt. Reyes, CA (East Pacific) |
|||||
|---|---|---|---|---|---|---|---|
| Forecast Period |
Valid Time (UTC) |
Transmission Time (UTC) |
Filename | Transmission Time (UTC) |
Filename | Transmission Time (UTC) |
Filename |
| 24-hour | 0000 | 0705 | PYEE79.TIF | 1400 | PYFE79.TIF | - | - |
| 1200 | 1905 | PYEE80.TIF | 0200 | PYFE80.TIF | - | - | |
| latest | PYEE10.TIF | PYFE10.TIF | - | ||||
| 48-hour | 0000 | 0715 | PYEI81.TIF | 1410 | PYFI81.TIF | 1435 | PYFI81.TIF |
| 1200 | 1915 | PYEI82.TIF | 0210 | PYFI82.TIF | 0215 | PYFI82.TIF | |
| latest | PYEI10.TIF | PYFI10.TIF | - | ||||
| 72-hour | 0000 | 0725 | PYEK83.TIF | 1420 | PYFK83.TIF | - | - |
| 1200 | 1925 | PYEK84.TIF | 0220 | PYFK84.TIF | - | - | |
| latest | PYEK10.TIF | PYFK10.TIF | - | ||||
Peak Wave Period and Direction Forecasts
![[Image of Peak Wave Period and Direction Forecast Area for East Pacific]](/gifs/peak_wave_epac.gif)
![[Image of Peak Wave Period and Direction Forecast Area for Atlantic]](/gifs/peak_wave_atl.gif)
Purpose
Peak wave period and direction forecast charts are produced to depict the 48- and 72-hour forecasts of how much time exists between the most energetic waves and what direction these waves are coming from over the tropical and subtropical Atlantic and East Pacific waters.
Content
The peak wave period (in seconds) is defined as the wave period associated with the most energetic waves in the total wave spectrum at a specific point. Wave regimes that are dominated by wind waves tend to have smaller peak wave periods, and regimes that are dominated by swell tend to have larger peak wave periods. It is important to note that these charts only depict the peak wave period and that there still could be other significant waves at a specific point that just happen to have less energy. Peak wave periods are contoured by isolating different swell events with a single line – not contouring at a specific interval as in other forecast graphics. Labels within the contours indicate the peak wave period in that general area. Arrows are also shown depicting the direction that the most energetic waves are traveling.
Coverage
The National Hurricane Center produces peak wave period and direction forecasts covering the following areas:
- Atlantic (from the equator to 31°N between 35°W and 100°W, including the Pacific east of 100°W)
- East Pacific (from 20°S to 30°N east of 145°W)
Issuance/Transmission
The peak wave period and direction forecasts are transmitted by radiofax via New Orleans, Pt. Reyes, and Honolulu according to the following table:
| New Orleans, LA (Atlantic) |
Pt. Reyes, CA (East Pacific) |
Honolulu, HI (East Pacific) |
|||||
|---|---|---|---|---|---|---|---|
| Forecast Period |
Valid Time(UTC) |
Transmission Time (UTC) |
Filename | Transmission Time (UTC) |
Filename | Transmission Time (UTC) |
Filename |
| 48-hour | 0000 | 0750 | PJEI88.TIF | 1228 | PJFI87.TIF | 1430 | PJFI87.TIF |
| 1200 | 1950 | PJEI89.TIF | 2346 | PJFI88.TIF | - | - | |
| latest | PJEI11.TIF | PJFI11.TIF | |||||
| 72-hour | 0000 | 0825 | PKEK88.TIF | 2356 | PJFK93.TIF | 0230 | PJFK93.TIF |
Graphicasts (Today's Marine Weather Story)
The Tropical Analysis and Forecast Branch (TAFB) is providing a graphical weather depiction that will highlight
primary weather features of interest.
A graphicast is produced for each basin. The graphicasts are intended to communicate to our users the most
critical marine or other significant forecast issue(s) of the day. This graphic is primarily used to communicate
heavy precipitation/flooding, volcanic ash, or other significant features that are not easily communicated in
TAFB's regular forecast products in an effort to provide enhanced decision support services (DSS).
The image has planned updates once per day in the early afternoon.
See the latest available Atlantic or
East Pacific Graphicast
Tropical/Subtropical Cyclone Position and Intensity Estimates
![[small picture of tropical cyclone]](gifs/smlui.gif)
TAFB provides the National Hurricane Center with position estimates of tropical cyclones every three hours and intensity estimates every six hours. Intensity estimates use the Dvorak technique, which is a statistical system using observed satellite cloud pattern and a set of rules to produce a current estimate of a cyclone's strength. Estimates can be made from both visible and infrared satellite imagery. The Dvorak technique is the main tool for determining tropical cyclone strength when it is out of range of reconnaissance aircraft.
TAFB also provides NHC with position and intensity estimates for subtropical cyclones (a hybrid between tropical cyclones and frontal or extratropical cyclones) using the Herbert-Poteat technique.
TAFB's position and intensity estimates are not currently available to the public. However, the intensity estimates (called T numbers, CI numbers, and ST numbers), are often referred to in NHC's Tropical Cyclone Discussions and Preliminary Reports. The following table (taken from the reports mentioned below) gives the approximate wind and pressure values for the CI and ST numbers.
| CI Number |
Sustained winds |
Atlantic Min. Pres. |
W Pacific Min. Pres. |
ST Number |
Sustained winds |
|---|---|---|---|---|---|
| 1.0 | 25 kt | – | – | – | – |
| 1.5 | 25 kt | – | – | 1.5 | 25-30 kt |
| 2.0 | 30 kt | 1009 mb | 1000 mb | – | – |
| 2.5 | 35 kt | 1005 mb | 997 mb | 2.5 | 35-40 kt |
| 3.0 | 45 kt | 1000 mb | 991 mb | 3.0 | 45-50 kt |
| 3.5 | 55 kt | 994 mb | 984 mb | 3.5 | 55-65 kt |
| 4.0 | 65 kt | 987 mb | 976 mb | – | – |
| 4.5 | 77 kt | 979 mb | 966 mb | – | – |
| 5.0 | 90 kt | 970 mb | 954 mb | – | – |
| 5.5 | 102 kt | 960 mb | 941 mb | – | – |
| 6.0 | 115 kt | 948 mb | 927 mb | – | – |
| 6.5 | 127 kt | 935 mb | 914 mb | – | – |
| 7.0 | 140 kt | 921 mb | 898 mb | – | – |
| 7.5 | 155 kt | 906 mb | 879 mb | – | – |
| 8.0 | 170 kt | 890 mb | 858 mb | – | – |
NHC uses the Atlantic pressure table for eastern Pacific tropical cyclones. Note that these are intensity estimates and may be superceded by reconnaissance and/or surface observations.
More information on the Dvorak technique is found in NOAA Technical Report NESDIS 11 - Tropical Cyclone Intensity Analysis Using Satellite Data - by Vernon F. Dvorak. More infomation on the Herbert-Poteat technique is found in NOAA Technical Memorandum NWS SR-83 - A Satellite Classification Technique for Subtropical Cyclones - by Paul J. Herbert and K.O. Poteat.
TAFB is currently testing an objective version of the Dvorak technique. This could provide intensity estimates every 30 minutes. More information can be obtained from Ray Zehr at the Cooperative Institute for Research in the Atmosphere, Colorado St. University, or from Chris Velden or Tim Olander at the Cooperative Insititute for Meteorological Satellite Studies, University of Wisconsin.
The National Hurricane Center currently does not post the Dvorak satellite intensity classifications to the website. Satellite classifications provided by the NOAA/NESDIS Satellite Services Division can be found on their website.Marine Radiofax Broadcast Schedule
![[small picture of radio towers]](graphics/radio_towers.jpg)
The Tropical Analysis and Forecast Branch (TAFB) provides marine analyses and forecasts for the Gulf of Mexico, Caribbean Sea, and the tropical and subtropical Atlantic and Pacific. Products available include: surface analyzes, sea state analyses, wind/seas forecasts, wave period/swell direction forecasts, tropical cyclone danger area forecaasts (during the hurricane season), text High Seas Forecasts, and GOES satellite imagery. These products are transmitted through the U.S. Coast Guard Stations at New Orleans, Louisiana, and Pt. Reyes, California. These and other National Hurriane Center products are also available from the National Weather Service Marine Fax page. Here is more information on receiving NWS marine products at sea.
The complete list of radiofax broadcasts can be found on the TAFB Radiofax Broadcast Schedule page.
Gridded Marine Forecasts
![[NDFD grid example]](/images/ndfd_thumb.gif)
The Tropical Analysis and Forecast Branch (TAFB) is providing forecasts of gridded surface (10-m) winds, surface (10-m) wind gusts, significant wave heights, and marine hazards to the National Digital Forecast Database (NDFD). These grids are produced by the forecaster through the AWIPS Graphical Forecast Editor (GFE).
Please see the gridded marine page for more information.
Spot Marine Forecasts
Purpose
The NWS Spot Forecast Request and Dissemination System provides authorized official users a way to request marine weather spot forecasts for marine incidents and National Weather Service (NWS) forecasters a way to post those forecasts to a national web server. It was developed with three main design principles: 1)ease of use for the spot forecast requestor, 2) quicker production of spot forecasts at the NWS office, and 3) provision of a "one-stop-shopping" location on the web for weather information pertaining to a particular marine incident.
Content
The Spot Forecast has the capability to provide the following user requested parameters:
- Weather
- 10-m Wind Speed and Direction
- Significant Wave Height
- Swell Height and Direction
- Swell Period
- Wind Wave Height
Coverage
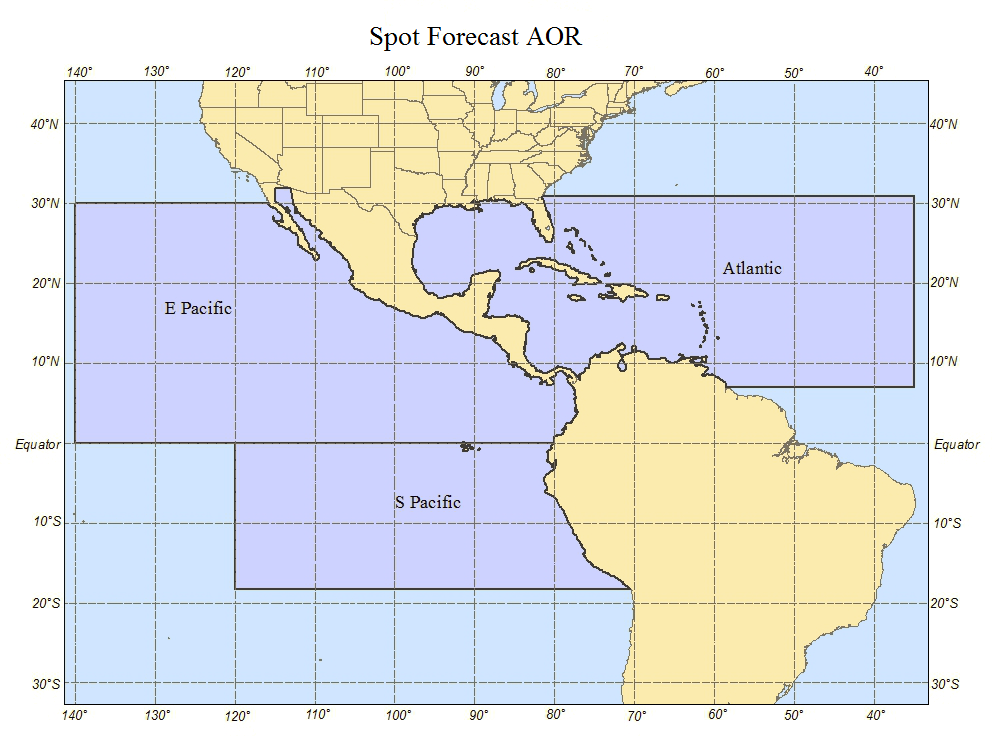
The National Hurricane Center issues Spot Marine Forecasts to convey detailed forecast conditions at a marine incident area. This area includes the Offshore Waters Forecast areas of the Gulf of Mexico, the Caribbean Sea, the Tropical North Atlantic, and the Southwest North Atlantic Ocean from 07N to 31N west of 55W, as well as the surrounding Atlantic High Seas Forecast areas from 07N to 31N west of 35W. The Northeast Pacific High Seas Forecast area is also covered from 0.4S to 30N east of 140W.
Issuance/Transmission
The Spot Request and Forecast is transmitted under World Meteorological Organization (WMO)
and NOAA Weather Wire Services (NWWS) headers as shown below:
| Identifiers | Description of Area |
| BMBB91 KNHC/MIASTQNHC | Spot Forecast Request |
| FNUS72 KNHC/MIAFWSNHC | Spot Forecast |
The Spot Forecast Request is submitted by authorized official users as needed. Official users are any federal, state, tribal, or local public officials, or their designated contractors, who need a marine spot forecast for operations related to public safety or protection of the environment. The Spot Forecast will be issued as needed as soon as possible after a Spot Forecast Request is submitted.