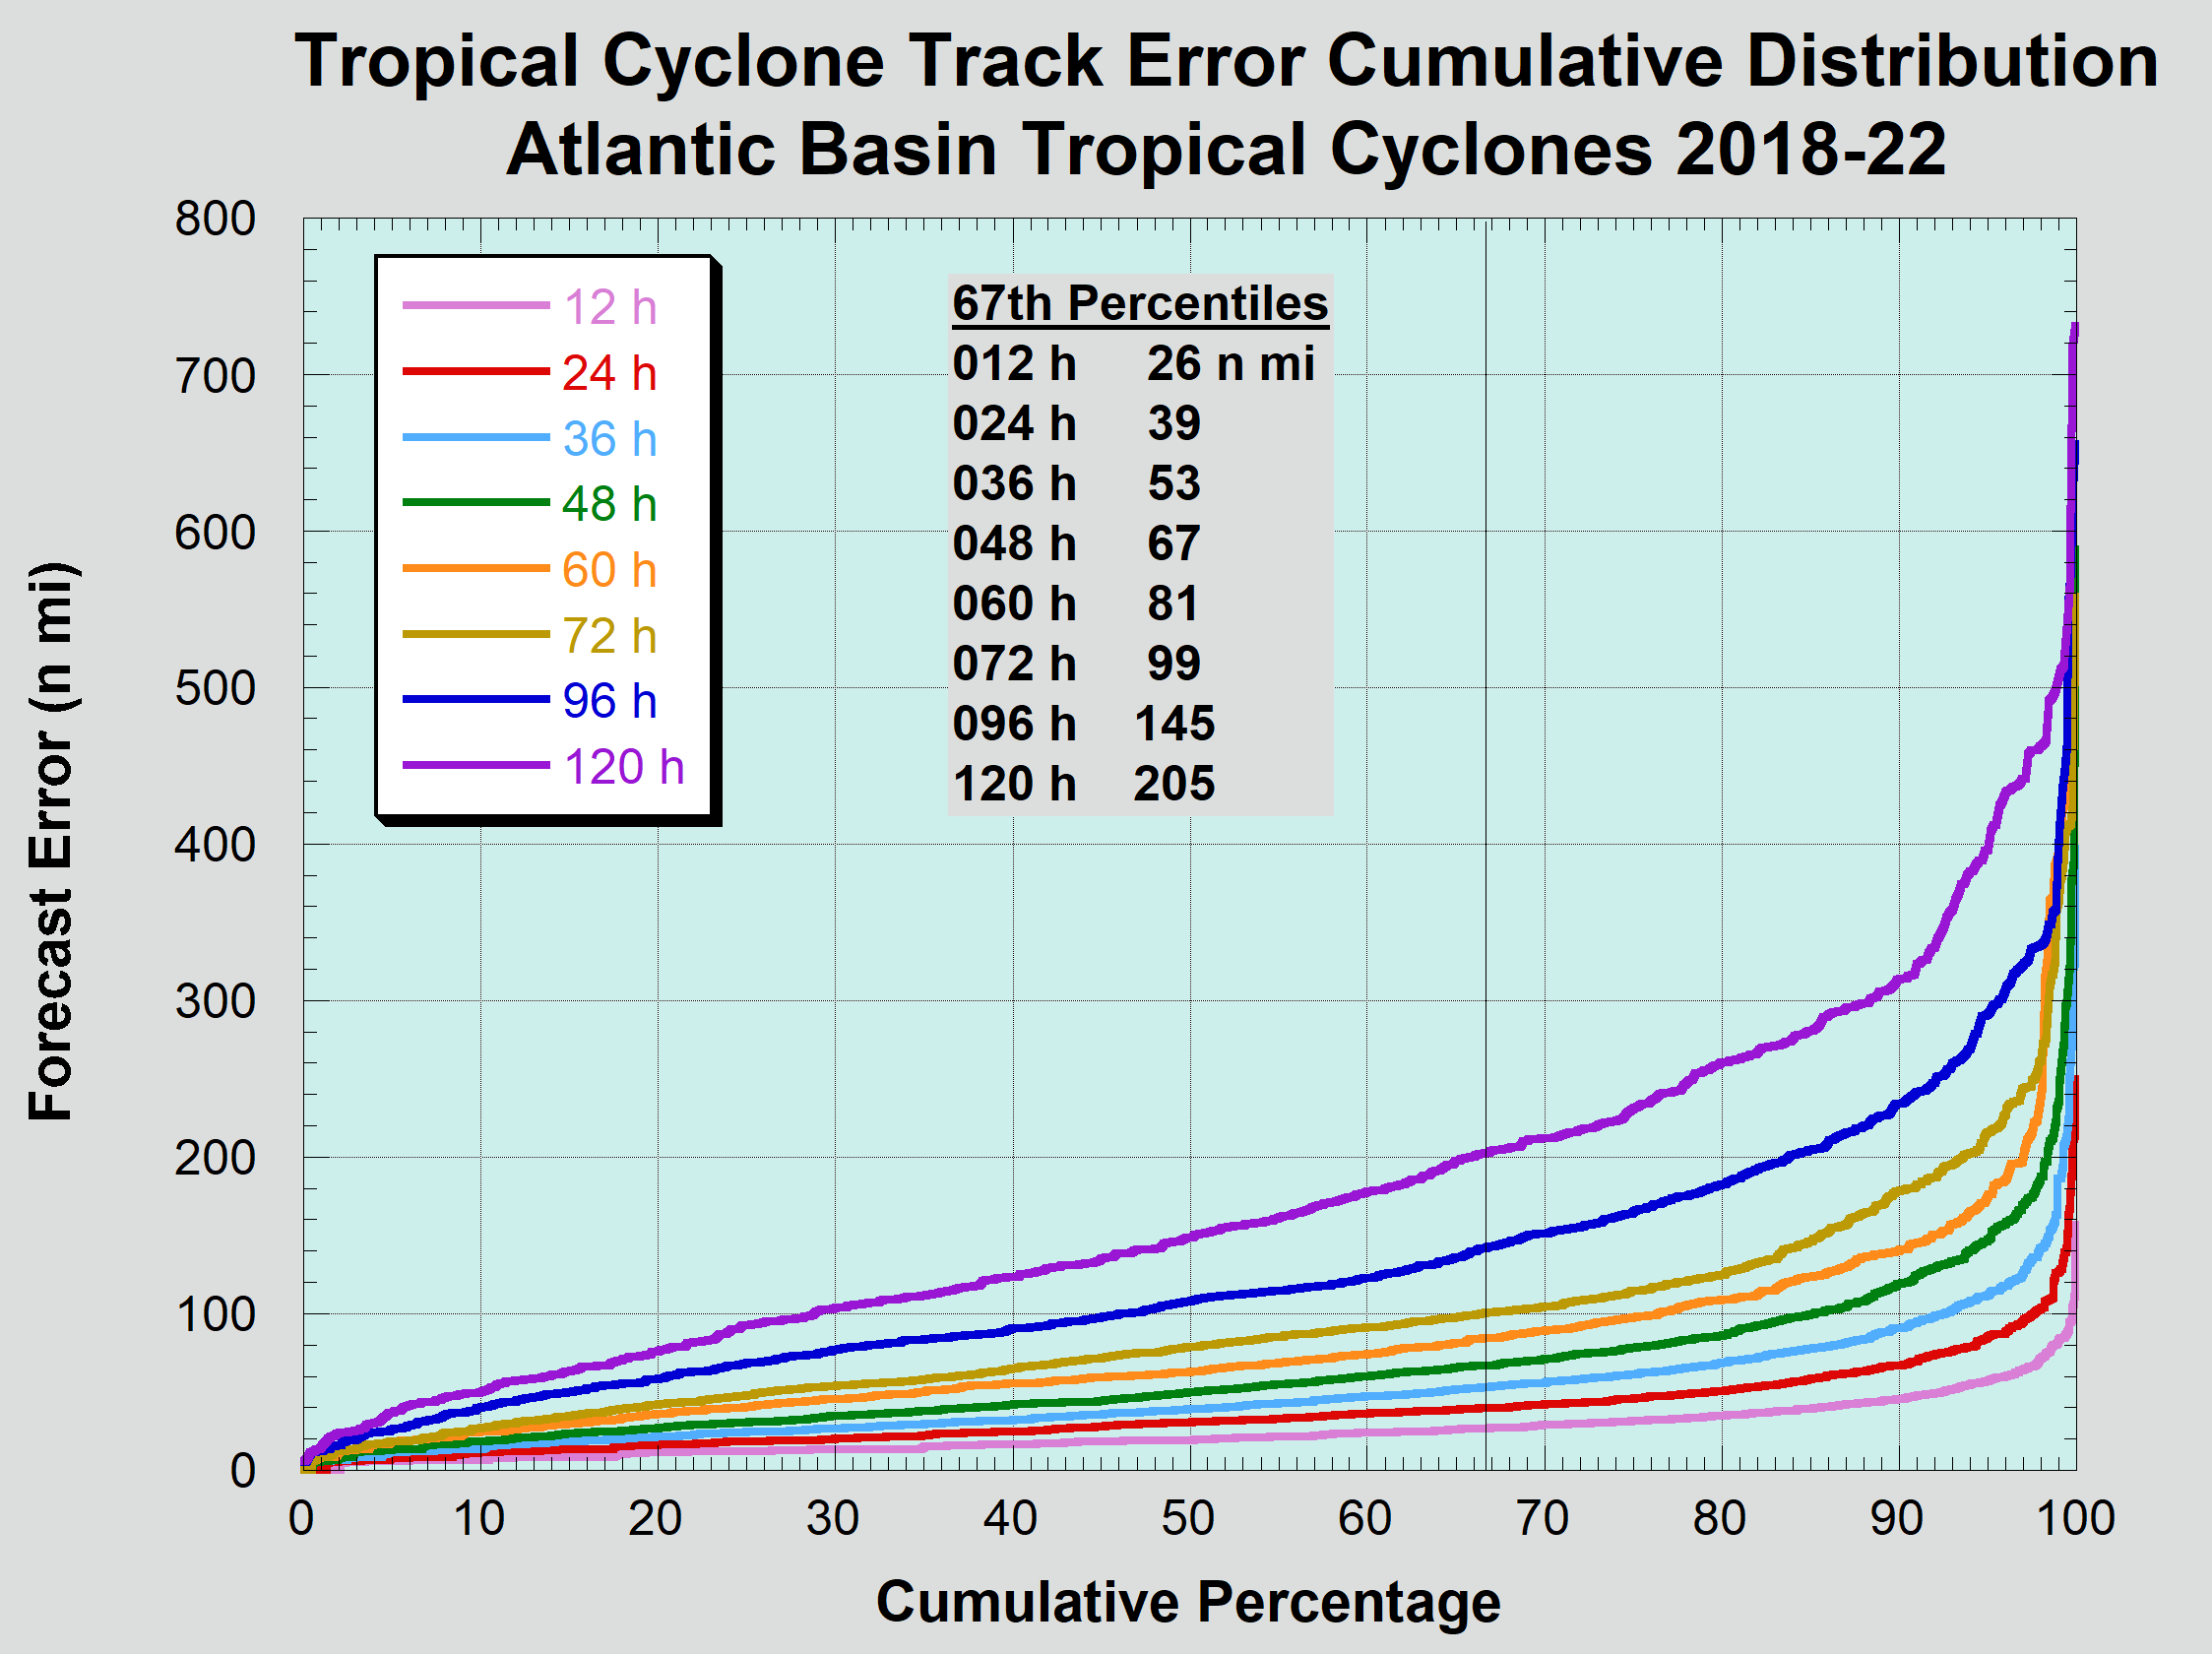
Cumulative distribution of five-year official Atlantic basin tropical cyclone track forecast errors.
NOTE - Radii of NHC and CPHC forecast cone circles calculated from the past 5 years of error statistics can be found on the Definition of the NHC Track Forecast Cone page.
Due to the natural volatility in tropical cyclone track characteristics, annual errors can vary significantly from year to year. For example, years dominated by tracks through the low latitude easterly trade winds typically have relatively small annual errors. Conversely, a relatively large number of forecasts in the mid-latitude westerlies (as can occur during El Niño years) can lead to larger errors. Consequently, representative or stable error characteristics must be obtained using a longer period of record.
NHC uses a 5-year sample to define its current forecast error characteristics. Average errors for the last 5 period are given below. These verifications follow the procedures given above in Section 2 (i.e., they include the subtropical and depression stages) and the sample is homogeneous with the operational CLIPER5 and Decay-SHIFOR5 models.
Atlantic/East Pacific: Mean official track and intensity forecast errors for the 5-year period 2018-2022 (.pdf)
Central Pacific: Mean official track and intensity forecast errors for the 5-year periods 2011-2015 – 2015-2019 (.pdf)The distributions of 5-year track and intensity errors are given graphically in the figures below.
Cumulative distribution of five-year official Atlantic basin tropical cyclone track forecast errors.
Diagram shows the percentage of official forecasts having an error less than the value along the y-axis. For example, to determine the fraction of 24 h forecasts having an error smaller than 100 n mi, find 100 n mi on the y-axis, and read across the diagram until this value intersects the red (24 h forecast) line. Then read down to obtain the percentage.
These track error
distributions are used to set the size of the "forecast error
cone" displayed on NHC track forecast web graphics. In these
graphics, the cone represents the probable track of the center of
a tropical cyclone, and is formed by enclosing the area swept out
by a set of circles along the forecast track (at 12, 24, 36 hours,
etc). The size of each circle is set so that two-thirds
(67%) of historical official forecast errors over a 5-year sample
fall within the circle. The circle radii defining the error cone
in 2023 for the
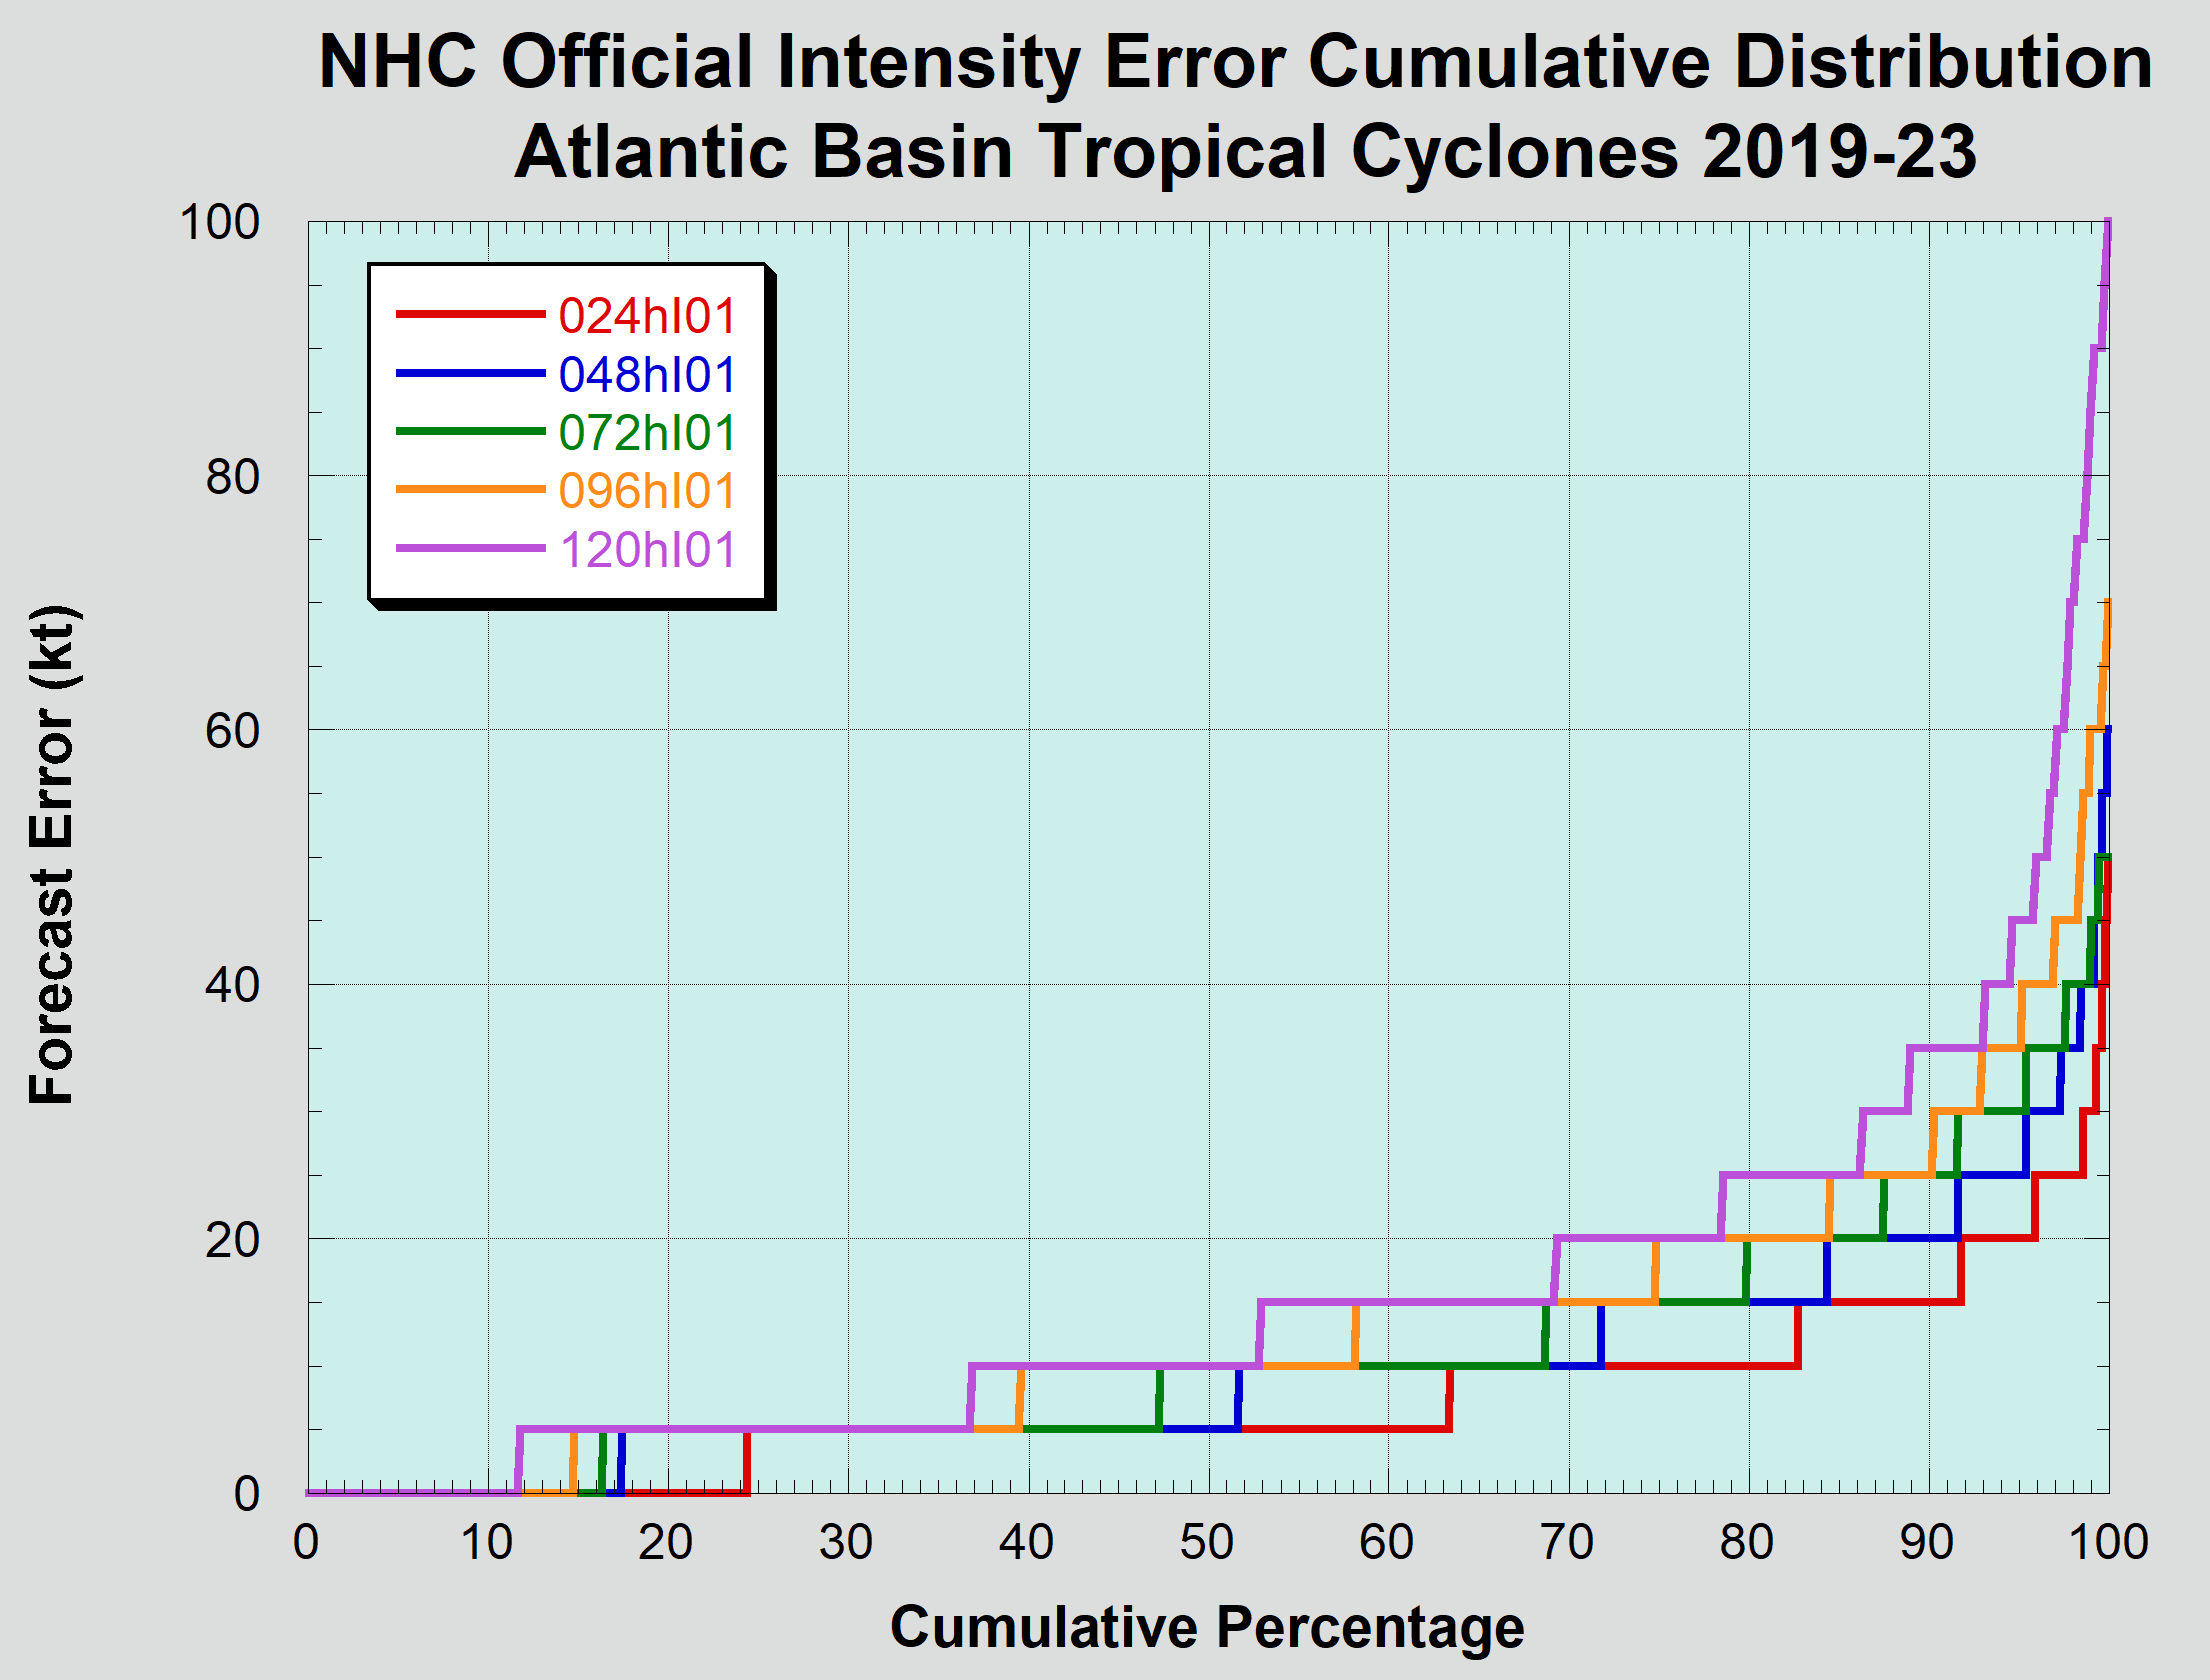
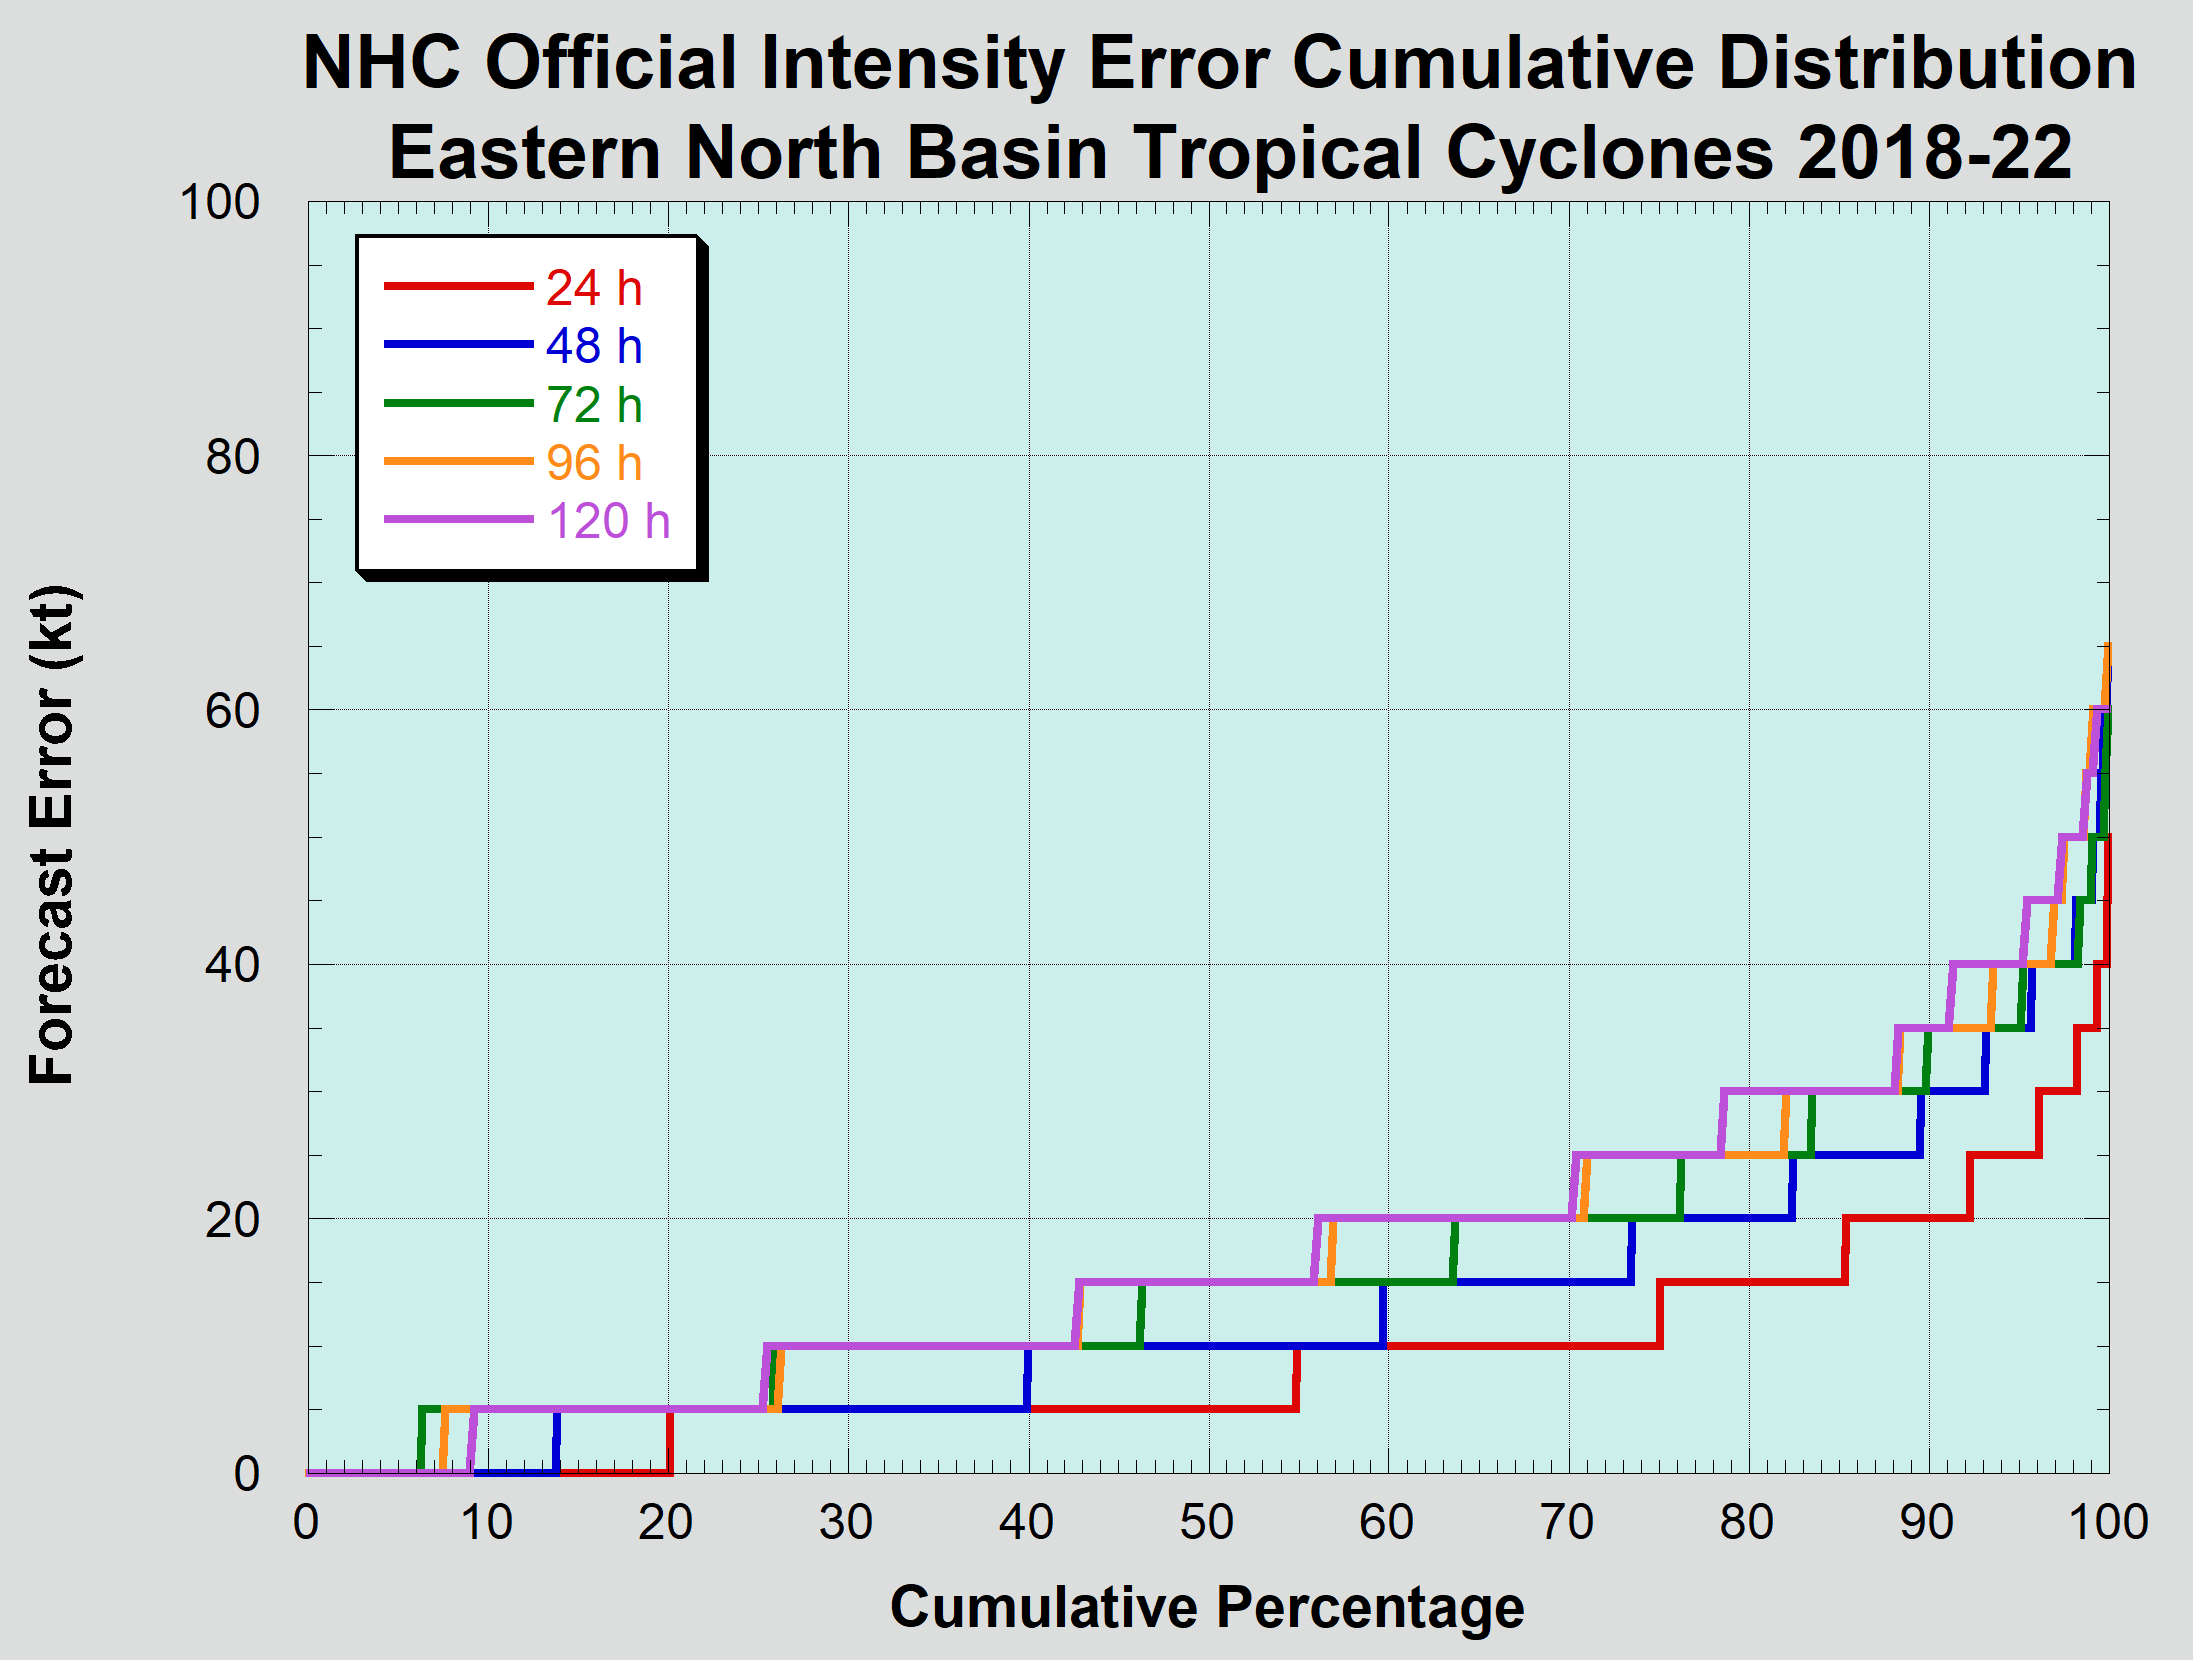
Diagram shows the percentage of official forecasts having an error magnitude less than the value along the y-axis. For example, to determine the fraction of 24 h forecasts having an error smaller than 20 kt, find 20 kt on the y-axis, and read across the diagram until this value intersects the red (24 h forecast) line. Then read down to obtain the percentage.
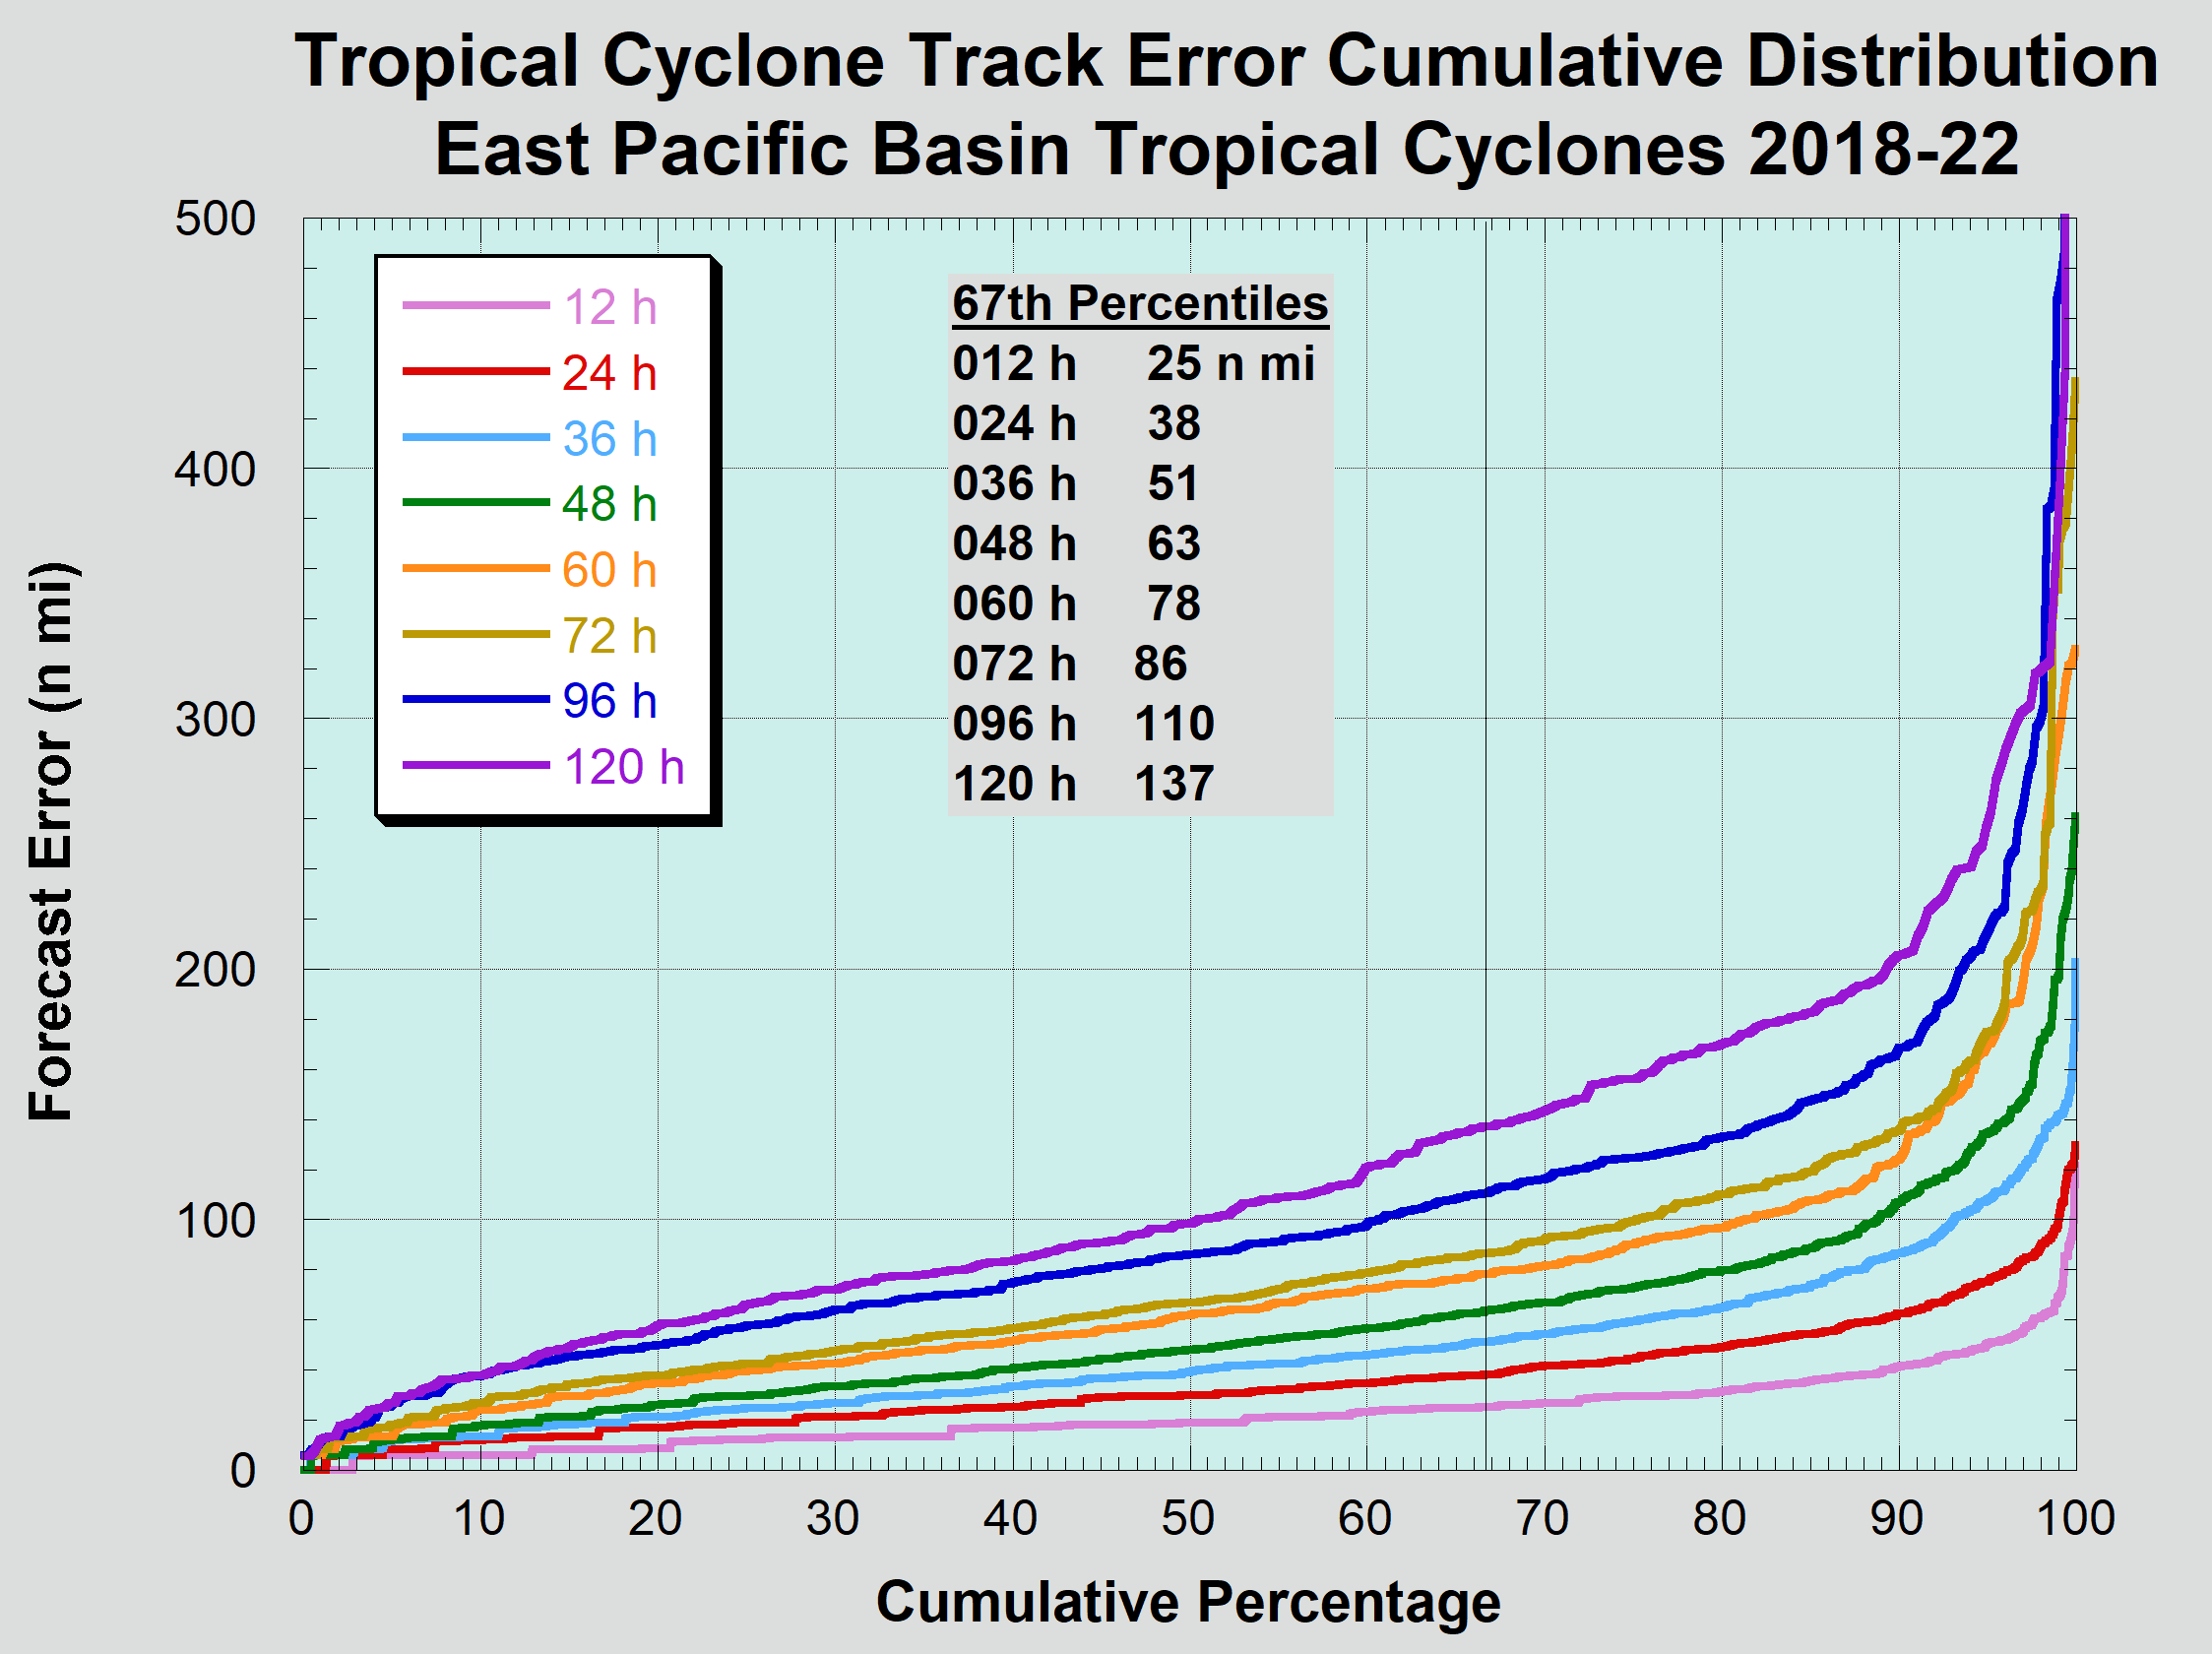
Diagram shows the percentage of official forecasts having an error less than the value along the y-axis. For example, to determine the fraction of 24 h forecasts having an error smaller than 100 n mi, find 100 n mi on the y-axis, and read across the diagram until this value intersects the red (24 h forecast) line. Then read down to obtain the percentage. The size of the circles defining the forecast error cone in 2023 for the eastern North Pacific basin are given in the figure above.
Next: Official error trends
Alternate Formats
About Alternates -
E-Mail Advisories -
RSS Feeds
Cyclone Forecasts
Latest Advisory -
Past Advisories -
About Advisories
Marine Forecasts
Latest Products -
About Marine Products
Tools & Data
Satellite Imagery -
US Weather Radar -
Aircraft Recon -
Local Data Archive -
Forecast Verification -
Deadliest/Costliest/Most Intense
Learn About Hurricanes
Storm Names
Wind Scale -
Prepare -
Climatology -
NHC Glossary -
NHC Acronyms -
Frequently Asked Questions -
AOML Hurricane-Research Division
About Us
About NHC -
Mission/Vision -
Other NCEP Centers -
NHC Staff -
Visitor Information -
NHC Library
NOAA/
National Weather Service
National Centers for Environmental Prediction
National Hurricane Center
11691 SW 17th Street
Miami, Florida, 33165-2149 USA
nhcwebmaster@noaa.gov
Disclaimer
Privacy Policy
Credits
About Us
Glossary
Career Opportunities
Page last modified: Friday, 12-May-2023 17:59:57 UTC