


Reynolds SST Analysis
| Atlantic |
Daily Analysis Analysis Loop Anomaly Loop |
| East Pacific |
Daily Analysis Analysis Loop Anomaly Loop |
SST Analysis Description
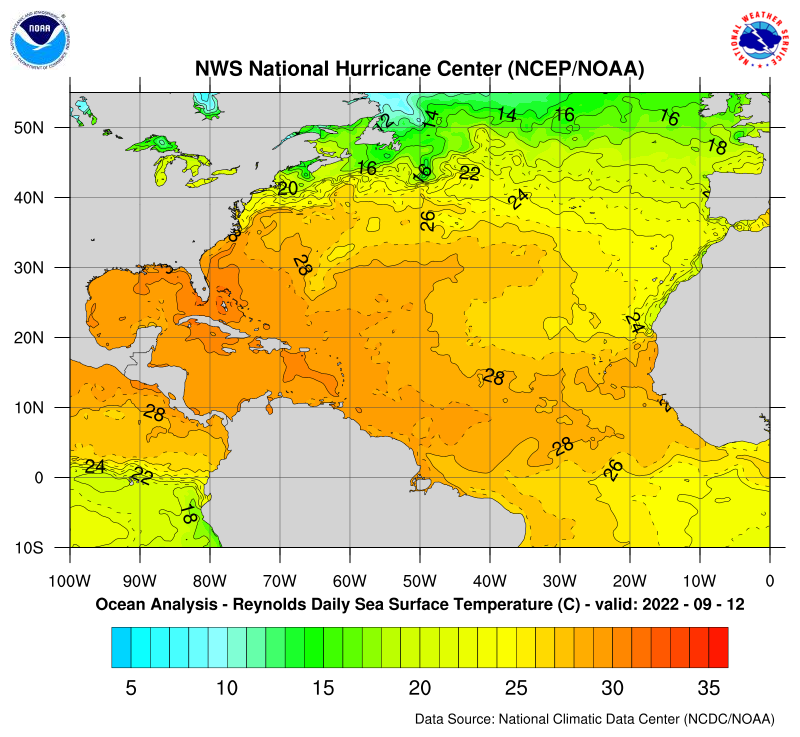
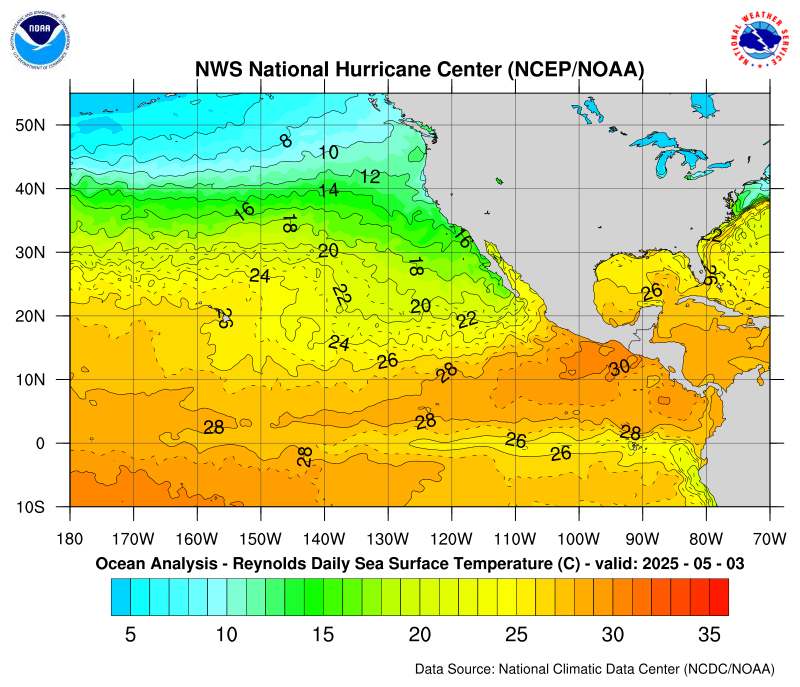
A real-time global sea surface temperature (SST) analysis has been developed by Richard Reynolds from the National Climatic Data Center (NCDC). Also, a monthly one-degree global SST climatology was constructed using these analyses by the Climate Prediction Center (CPC/NOAA). This climatology derived from monthly Optimum Interpolation (OIv2) SST analyses with an adjusted base period of 1971-2000 was used in computing the SST anomaly field using a weighted monthly mean climatology and the current observed Reynolds SST field. The actual areal coverage of the analysis and the anomally data is roughly between 60°S and 60°N globally. These analyses were based on ship and buoy SST data supplemented with satellite SST retrievals. The one degree climatology and analyses resolve equatorial upwelling and fronts.
The optimum interpolation (OIv2) SST analysis is produced weekly on a one-degree grid. The analysis uses buoy and ship data, satellite SST data, and SST's simulated by sea-ice coverage. Before the analysis is computed, the satellite data is adjusted for biases using the method described by Reynolds (1988) and Reynolds and Marsico (1993). A description of the analysis can be found in Reynolds and Smith (1994).
The National Hurricane Center uses the SST analyses in forecasting tropical cyclone intensity in statistical hurricane models. Every Monday or Tuesday the graphics are updated for the previous week. The SST analyses are separated into Eastern Pacific and Atlantic domains. An analysis and anomaly chart are produced for each domain. The analysis chart contains the current SST comprised from current observations. The anomaly chart is the global SST climatology subtracted from the SST analysis.
Monthly Mean Climatology Fields (1971-2000)
Atlantic: Jan - Feb - Mar - Apr - May - Jun - Jul - Aug - Sep - Oct - Nov - Dec
Pacific: Jan - Feb - Mar - Apr - May - Jun - Jul - Aug - Sep - Oct - Nov - Dec
Additional Links of Interest
NOAA/NESDIS Sea Surface Temperature (SST) Charts
NOAA Climate Diagnostics Center SST Images
NCDC Archives – NOAA Optimum Interpolation 1/4 Degree Daily Sea Surface Temperature Analysis
University of Wisconsin – Sea Surface Temperatures (SST)
References
Reynolds, R. W., T. M. Smith, C. Liu, D. B. Chelton, K. S. Casey, and M. G. Schlax, 2007: Daily high-resolution blended analyses for sea surface temperature. J. Climate, 20, 5473-5496.
Reynolds, R. W. and T. M. Smith, 1994: Improved global sea surface temperature analyses using optimum interpolation. J. Climate, 7, 929-948.
Reynolds, R. W. and D. C. Marsico, 1993: An improved real-time global sea surface temperature analysis. J. Climate, 6, 114-119.
Reynolds, R. W., 1988: A real-time global sea surface temperature analysis. J. Climate, 1, 75-86.