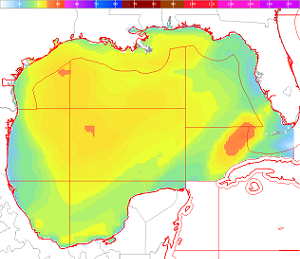
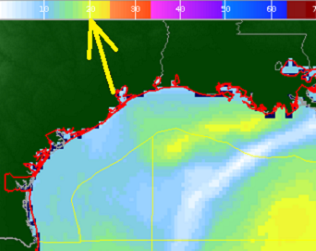
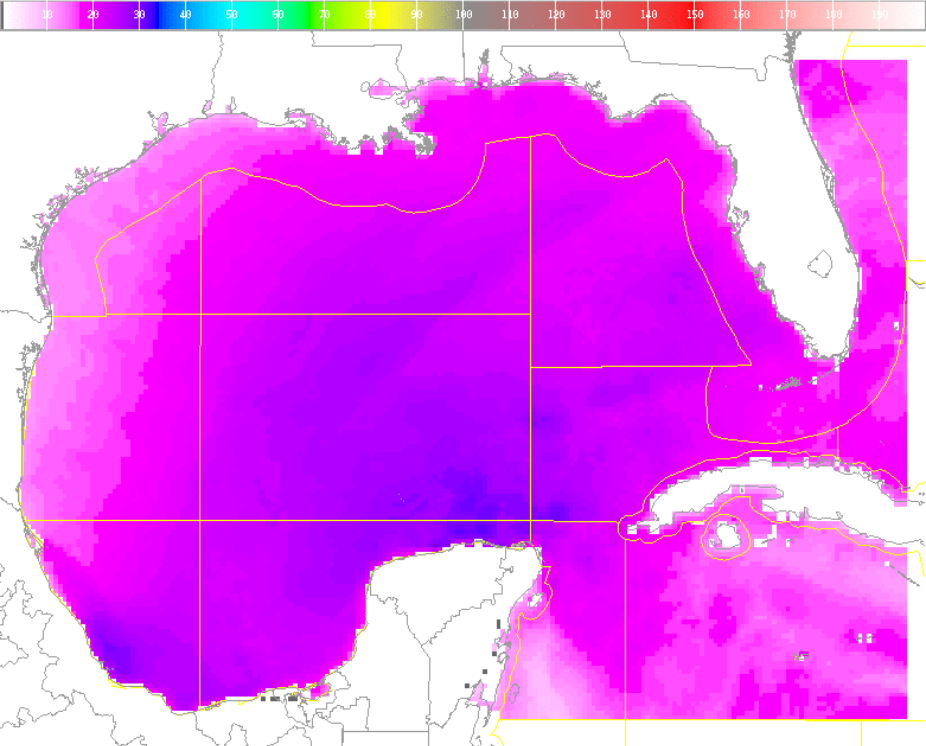
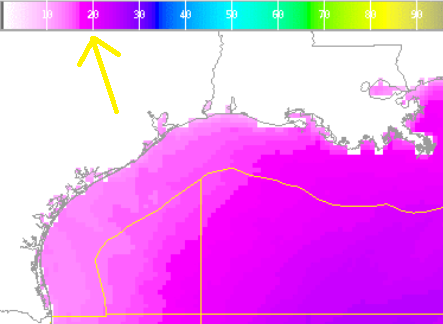
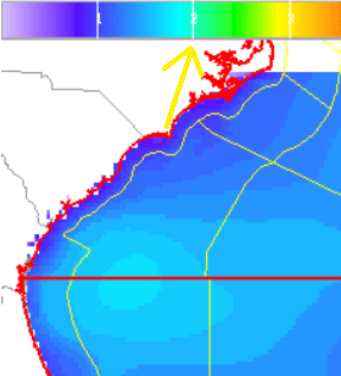
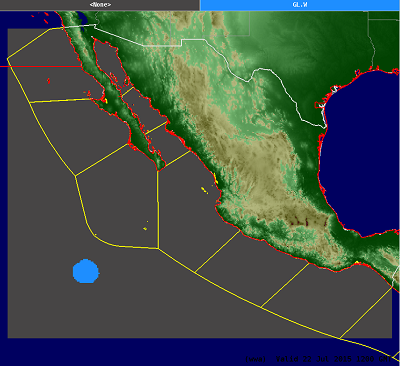
| Wind 10m, 30m and 50m (kt) Image: | Available at the 10m, 30m and 50m levels. The color coded wind image can help to see wind patterns and strength over an area. The color on the map can be matched with the color in the color bar at the top of the image to determine the wind speed (in knots) at a given location. In the example below the yellow colors in the black box corresponds to around 20 kt of wind speed. |
|
 |
 |
|
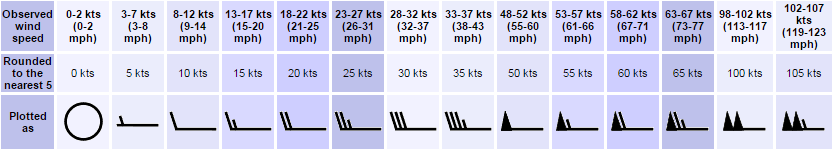
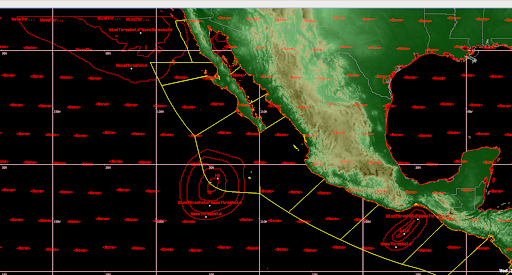
| Wind 10m, 30m and 50m (kt) Barbs: | Available at the 10m, 30m and 50m levels. A combination of long/short barbs and pennants indicate the speed of the wind in station weather plots rounded to the nearest 5 knots. Calm wind is indicated by a large circle drawn around the skycover symbol.
|
|
 |
||
The wind direction is indicated by the long shaft. The shaft will point to the direction FROM which the wind is blowing. The direction is based upon a 36-point compass. | 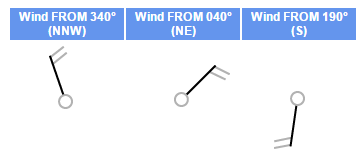 |
|
| Maximum 10m Wind (kt): | Available at the 10m level. A 120 hour maximum wind grid. The color coded wind image can help to see wind patterns and strength over an area. The color on the map can be matched with the color in the color bar at the top of the image to determine the wind speed (in knots) at a given location. In the example below the yellow colors in the black box corresponds to around 20 kt of wind speed. |
|
 |
 |
|
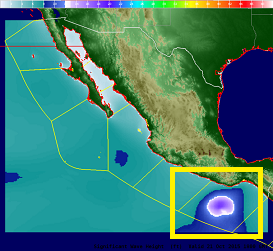
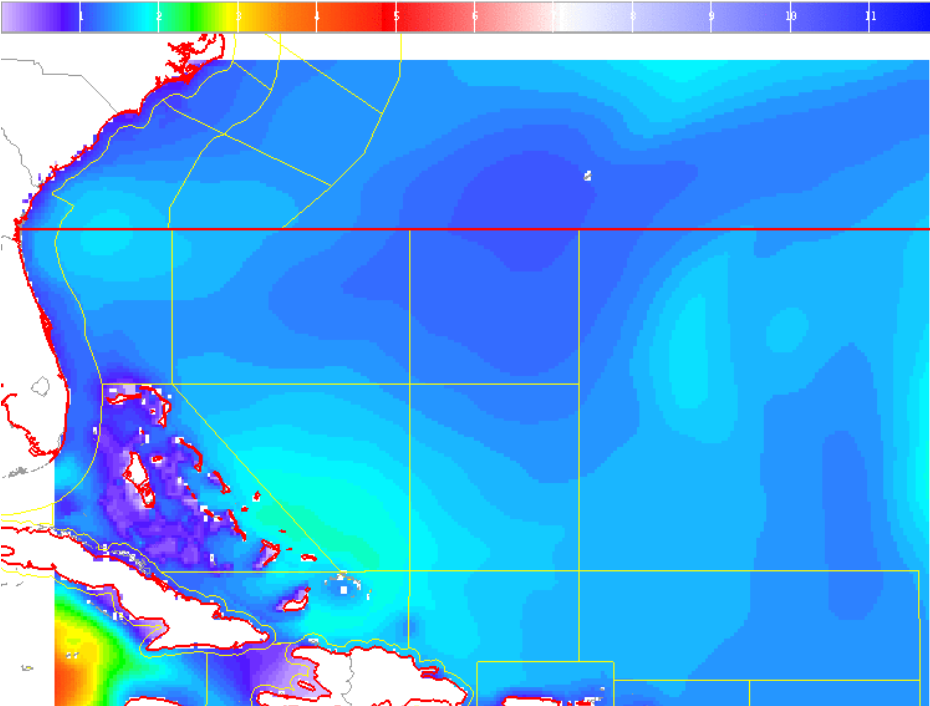
| Wave Height (ft) Image: | The color coded wave height image is show in feet. The color on the map can be matched with the color in the color bar at the top of the image to determine the wave height (in feet) at a given location. In the example below, the peak wave height in the yellow boxed area corresponds to between 14 and 18 ft on the color bar. |
|
 |
 |
|
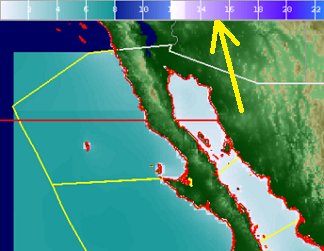
| Wave Height (m) Image: | The color coded wave height image is show in meters. The color on the map can be matched with the color in the color bar at the top of the image to determine the wave height (in meters) at a given location. In the example below, the peak wave height in the yellow boxed area corresponds to around 2 m on the color bar. |
|
 |
 |
|
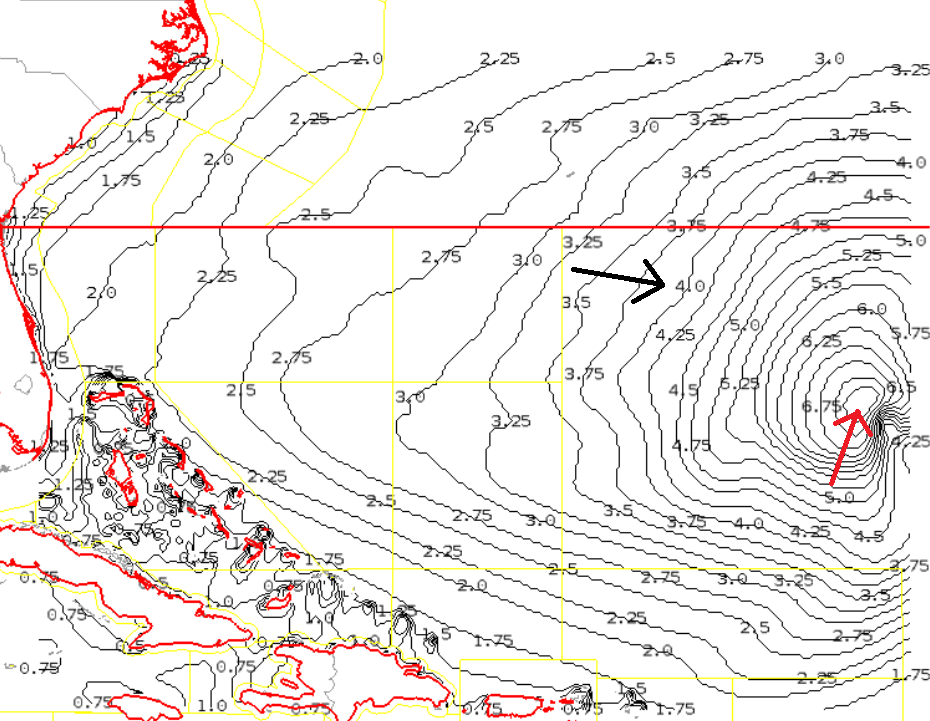
| Wave Height Contour (ft): | Wave height contours are lines of equal wave heights that occur on the map for every half foot of wave height difference. The black arrow on the image to the right shows the 4 foot wave height contour, indicating a large area of seas to 4 feet. The red arrow points inside the 6 foot contour, indicating a small area with seas to 6 feet, surrounded by an area of seas of 4 to 6 feet. |
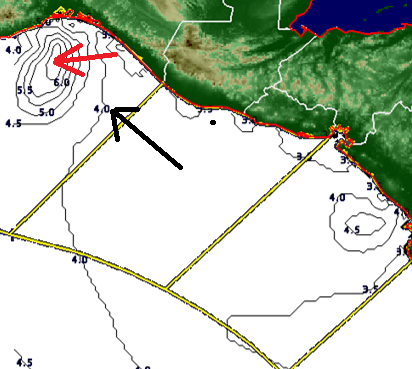 |
| Wave Height Contour (m): | Wave height contours are lines of equal wave heights that occur on the map for every 0.25 meter of wave height difference. The black arrow on the image to the right shows the 4 meter wave height contour, indicating a large area of seas to 4 meters. The red arrow points inside the 6.75 meter contour, indicating a small area with seas to 7 meters, surrounded by an area of seas of 6.75 meters. |
 |
| Hazards: | There are 4 types of hazards that can be displayed in the offshore zones on the hazards graphic: | |
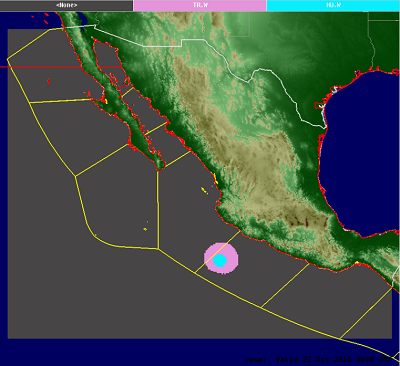
| The first hazard type is for non-tropical system gale force winds or storm force winds. Gale force winds are defined as sustained winds between 34 and 47 kts. Storm force winds are 48 kt or higher. On the map, a gale will show up in blue (see example below). Non-tropical system storm force winds will show up as dark pink. | For tropical systems, the tropical storm force winds (34 to 63 kt) will show up in a light pink color. Hurricane force winds (64 kt or higher) will be light blue. (see example below) | |
 |
 |
|
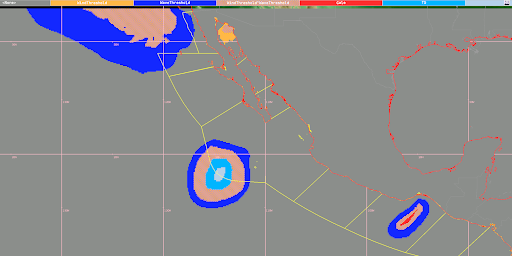
| High Seas Image: | There are 7 types of high seas that can be displayed in the offshore zones on the high seas graphic: The first high seas type is for the wave threshold which is defined as 8 ft or greater. On the map, areas of Wave Threshold will show up in blue. The second high seas type is for the Wind Threshold which is defined as 22.5 kt or greater. On the map, areas of wave threshold will show up in orange. The third, fourth and fifth high seas types are for non-tropical system Gale, Storm and Hurricane Force winds. Gale force winds are defined as sustained winds between 34 and 47 kts. Storm force winds are 48 kt or higher. Hurricane Force winds are 64 kt or higher. On the map, a Gale area will show up in red, a Storm area will show up in green, a Hurricane Force area will show up in teal. The sixth and seventh high seas types are for Tropical Storm (TS) and Hurricane (HU). Tropical Storm force winds (34 to 63 kt) will show up in light blue Hurricane winds (64 kt or higher) will show up in grey.
|
|
 |
||
| High Seas Polygons: | High Seas Polygons for each of the above high seas types are also available. These polygons will show the outer edge of the forecast high seas types and will vary in shape given the area. Please see the example below. |
|
 |
||