


Experimental Potential Storm Surge Flooding Map
Contents
1. Overview
This information is also available in an NWS Product Description Document (PDF format).
Although storm surge is often the greatest threat to life and property from a tropical storm or hurricane, many people do not understand the storm surge hazard and the threat it represents to them. Storm surge flooding directly accounts for about half of the deaths associated with tropical cyclones. In an effort to improve overall awareness and understanding of the storm surge flooding threat, the National Hurricane Center (NHC) will be issuing an experimental Potential Storm Surge Flooding Map effective 2014 for tropical cyclones affecting the East and Gulf Coasts of the United States. During this experimental time period, the National Weather Service (NWS) is seeking user feedback on this map issued by the NHC. Click here to take the NWS customer survey for this experimental product.
2. Product Description
The Potential Storm Surge Flooding Map is an experimental NWS product that will clearly and concisely depict the risk associated with the storm surge hazard from a tropical cyclone. Developed over the course of several years in consultation with social scientists, emergency managers, broadcast meteorologists, and others, this map shows:
- Geographical areas where inundation from storm surge could occur
- How high above ground the water could reach in those areas
Specifically, areas of possible storm surge flooding for a given storm are represented in different colors on the map based on water level:
What the Map Takes into Account
The experimental Potential Storm Surge Flooding Map is based on the forecast track, intensity, and size of a tropical storm or hurricane. Meteorological uncertainty exists in the forecast, and this map incorporates potential forecast errors by using an existing NWS product developed by the NWS Meteorological Development Laboratory (MDL), in cooperation with the NHC, called Probabilistic Hurricane Storm Surge (P-Surge 2.5). P-Surge 2.5 is an ensemble model based on the NWS Sea, Lake, and Overland Surges from Hurricanes (SLOSH) model.
The calculation of P-Surge 2.5 is accomplished by statistically evaluating a large set of SLOSH model simulations based on the current NHC official forecast, and taking into account historical errors in the official NHC track and intensity forecasts. P-Surge 2.5 computes the possible storm surge from each of these simulated storms using the SLOSH model and combines the results to calculate a statistical distribution of possible storm surge heights at locations along the coast within the next 80 hours. All the major factors that influence the amount of storm surge generated by a storm at a given location are accounted for, including: the hurricane's landfall location; storm intensity, size, forward speed, and angle of approach to the coast; the shape of the coastline; the slope of the ocean bottom; and local features such as barrier islands, bays, and rivers. The experimental Potential Storm Surge Flooding Map is created by processing the resulting storm surge values that have a 1-in-10 chance of being exceeded at each location.
The experimental Potential Storm Surge Flooding Map takes into account:
- Flooding due to storm surge from the ocean, including adjoining tidal rivers, sounds, and bays
- Normal astronomical tides
- Land elevation
- Uncertainties in the track, landfall location, intensity, forward speed, and size of the cyclone
The experimental Potential Storm Surge Flooding Map does not take into account:
- Wave action
- Freshwater flooding from rainfall
- Flooding inside levees and overtopping of levees
The potential storm surge hazard is not depicted within certain levee protected areas, such as the Hurricane & Storm Damage Risk Reduction System in Louisiana. These areas are highly complex and local officials are best equipped to forecast and monitor the threat of storm surge flooding inside these areas. Customers are asked to consult local officials for flood risk inside these leveed areas.
What the Map Represents
The experimental Potential Storm Surge Flooding Map represents the storm surge heights that a person should prepare for before a storm, given the uncertainties in the forecast. The map shows a reasonable estimate of worst case scenario flooding of normally dry land at particular locations due to storm surge. There is a 1-in-10 chance that the storm surge flooding at any particular location could be higher than the values shown on the map.
3. Methodology
How is the Potential Storm Surge Flooding map created?
NHC processes the storm surge values from P-Surge through GIS to create the experimental Potential Storm Surge Flooding Map. To calculate inundation, accurate elevation data is critical. The NOAA Coastal Services Center (CSC) has provided the underlying high-resolution elevation data for this GIS process, and NHC executes a detailed technical process using various techniques to merge the P-Surge storm surge data to a re-sampled version of the elevation data. NHC then subtracts the land elevation values from the P-Surge storm surge to yield flooding over land. The map is then displayed on the NHC website in an interactive viewer. The purpose of the interactive viewer is to show the experimental Potential Storm Surge Flooding Map at a community or city level.
4. Availability
When is the Map Issued?
NHC will release the initial map with the first issuance of a hurricane watch or warning or, in some special cases, a tropical storm watch or warning, for any portion of the Gulf or East Coast of the United States (anytime within 48 hours of the anticipated onset of tropical storm force winds). The map is subject to change every six hours in association with every new NHC full advisory package. The experimental map will be available approximately 25 to 30 minutes following completion of P-Surge 2.5.
For the experimental period, the map will only be available on the NHC website via an interactive viewer: http://www.nhc.noaa.gov/cyclones. In addition, there will be no GIS data dissemination during this experimental period.
5. Examples
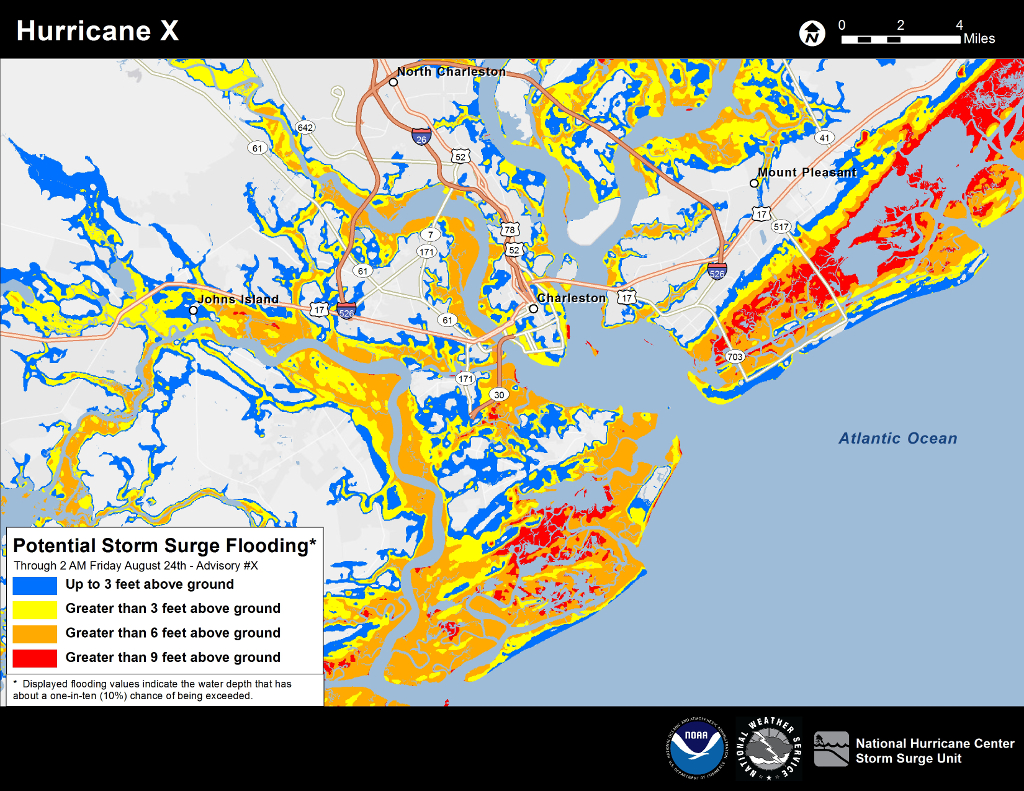

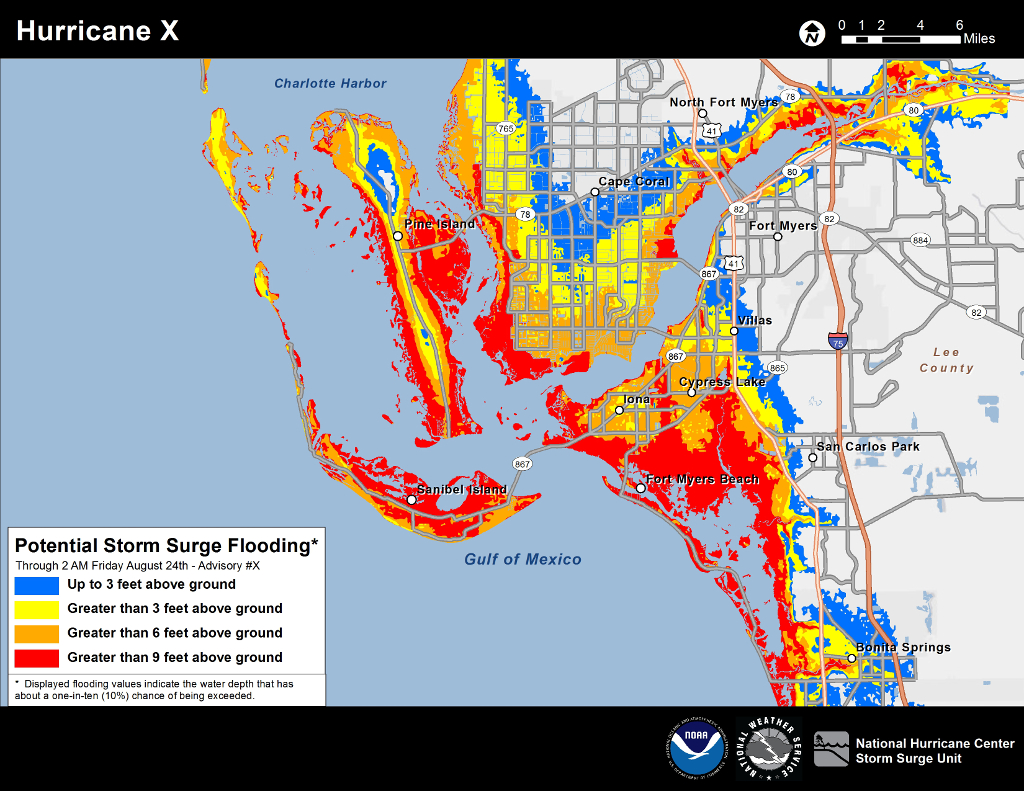
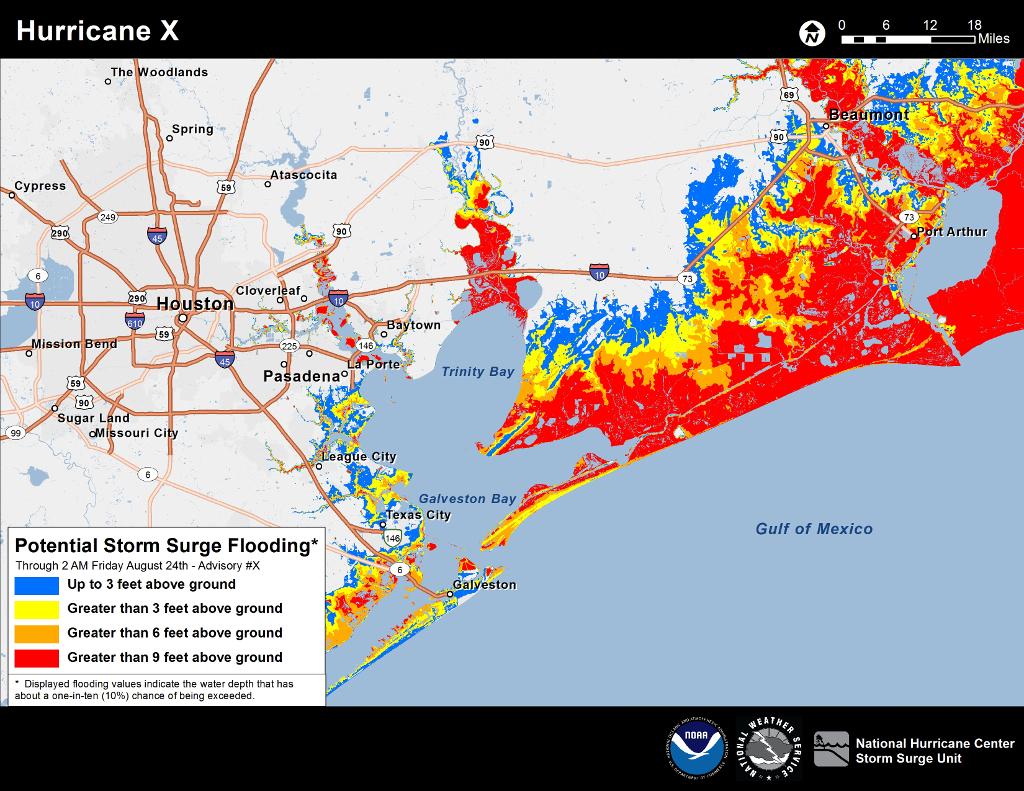 Examples: These are static examples of the experimental Potential Storm Surge Inundation Map. Note that the product will be interactive with pan and zoom capability.
6. Feedback and Comments
The NHC Storm Surge Unit is requesting your comments and feedback on the experimental Potential Storm Surge Flooding Map. During this period, we encourage your comments or suggestions for improvements, and your feedback will help us determine product utility, if modifications are needed, and whether the product should become part of our operational suite.
Please feel free to use any of the methods below for submitting comments.
Short Web Survey
www.nws.noaa.gov/survey/nws-survey.php?code=PSSFM
Mailing Address
For technical questions:
Jamie Rhome
National Hurricane Center
Storm Surge Team Lead
11691 SW 17th Street
Miami, FL 33165
For policy questions:
John Kuhn
National Weather Service
Marine and Coastal Weather Services Branch
1325 East West Highway
Silver Spring, MD 20910
Feedback Form