


Arrival of Tropical-Storm-Force Winds Graphics
Contents
1. Overview
This information is also available in an NWS Product Description Document (PDF Format).
The anticipated arrival of sustained tropical-storm-force winds from a tropical cyclone is a critical threshold for coastal communities. For example, emergency managers use this information to determine when to begin and complete coastal evacuations, while the public needs to know when to prepare their homes or businesses and get supplies. Once sustained tropical-storm-force winds begin, such preparations usually become too dangerous or difficult. Historically, many decision makers have inferred the arrival of sustained tropical-storm-force winds from NHC products deterministically, without accounting for tropical cyclone track or size uncertainty. The risk in not factoring in these uncertainties is that communities may have less time to prepare if a tropical cyclone speeds up or increases in size beyond NHC's initial forecasts.
To better meet users' needs, NHC has developed a set of prototype graphics that depict when sustained tropical-storm-force winds from an approaching tropical cyclone could arrive at individual locations. The prototype maps were developed and tested using social science techniques, including one-on-one telephone interviews, focus groups, and surveys with emergency managers, broadcast meteorologists, and NWS meteorologists to gather opinions on the idea, content, and design of the products.
2. Product Description
The timing graphics are created using the same Monte Carlo wind speed probability model that is currently used to determine the risk of tropical-storm- and hurricane-force winds at individual locations – a model in which 1000 plausible scenarios are constructed using the official NHC tropical cyclone forecast and its historical errors. Additional information on this product and the underlying technique is available online at:http://www.nhc.noaa.gov/about/pdf/About_Windspeed_Probabilities.pdf
There will be two versions of the experimental Arrival of Tropical-Storm-Force Winds Graphic available on the NHC website for all tropical cyclones, post-tropical cyclones, and potential tropical cyclones for which NHC is issuing advisories:
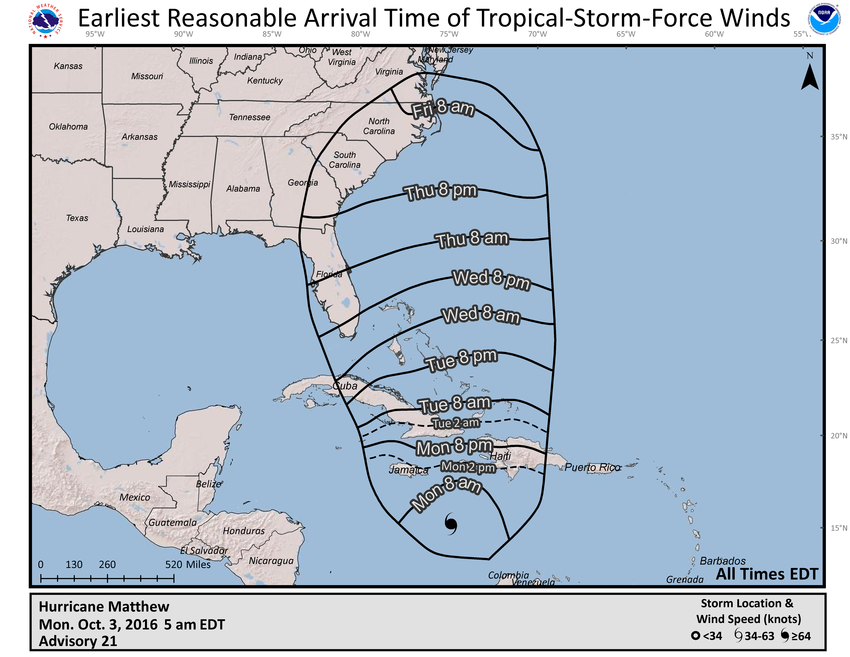
- Earliest Reasonable Arrival Time: the primary graphic, which identifies the time window that users at individual locations can safely assume will be free from tropical-storm-force winds. Specifically, this is the time before which there is no more than a 1-in-10 (10 percent) chance of seeing the onset of sustained tropical-storm-force winds – the period during which preparations should ideally be completed for those with a low tolerance for risk.
- Most Likely Arrival Time: the graphic that identifies the time before or after which the onset of tropical-storm-force winds is equally likely. This graphic would be more appropriate for users who are willing to risk not having completed all their preparations before the storm arrives.
Timing information will only be available for locations that have at least a 5 percent chance of experiencing sustained tropical-storm-force winds during the next 5 days.
Each of these versions will also be available overlaid on top of the cumulative 5-day probability of tropical-storm-force winds, providing a single combined depiction of the likelihood of tropical-storm-force winds at individual locations, along with their possible or likely arrival times.
The graphics will be updated with each new NHC full advisory package. Arrival times will be depicted with higher temporal resolution (i.e., in 6-hour intervals) during the first day of the 5-day forecast, increasing to lower temporal resolution (i.e., in 12-hour intervals) after the first day of the 5-day forecast period. Arrival times will be referenced to 8 AM and 8 PM local time, using a constant time zone that corresponds to where the cyclone is located at the time of the advisory. For example, if a cyclone is located in the Eastern Time Zone at the time of an advisory but is forecast to move into the Central Time Zone during the 5-day forecast period, all times on the graphic will be referenced to the Eastern Time Zone.
3. Availability
NHC will issue the set of graphics with every full advisory package for tropical cyclones, post-tropical cyclones, and potential tropical cyclones in the Atlantic and eastern North Pacific basins for which advisories are being written. The graphics are expected to be available within 10 minutes after the nominal advisory times.
The default graphic will be available as a clickable thumbnail within the storm window box for active cyclones on the NHC main webpage. After clicking on the thumbnail, users can select any of the four versions. No underlying data will be disseminated during the experimental period.
The data are available in KML/KMZ format on the NHC GIS page and are available in GRIB2 format via FTP.
4. Examples
| Arrival Time of TS Winds | 5-day Windspeed Probabilities |
|
|
|
Mailing Address
Jessica Schauer
NWS Marine, Tropical and Tsunami Services Branch
National Hurricane Center
11691 SW 17th Street
Miami, FL 33165