Download the NHC Product Description User's Guide for all tropical cyclone-related products.
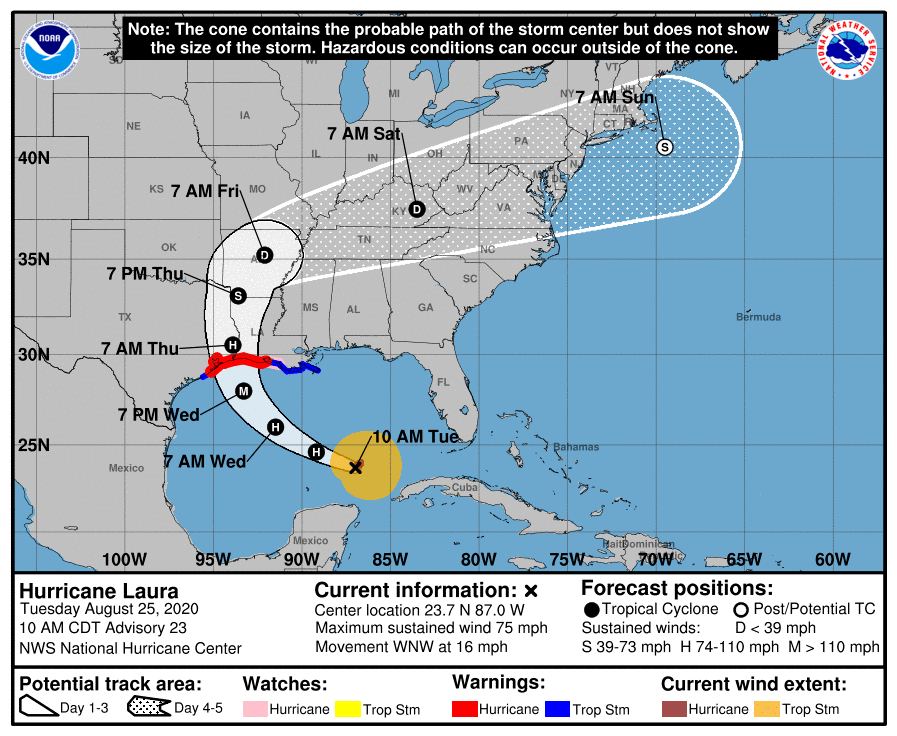
This graphic depicts the most recent NHC track forecast of the center of a tropical cyclone along with an approximate representation
of associated coastal areas under a hurricane warning (red), hurricane watch (pink), tropical storm warning (blue) and tropical storm
watch (yellow). The “X” indicates the current position of the center of the tropical cyclone. The black dots show the NHC forecast position
of the center at the times indicated. The letter inside the dot indicates the forecast strength of the cyclone category: (D)epression,
(S)torm, (H)urricane, (M)ajor hurricane, or remnant (L)ow. Systems forecast to be post-tropical are indicated by white dots with black
letters indicating intensity using the thresholds given above. For example, a post-tropical system forecast to have winds of 75 mph would
be depicted by a black H inside a white dot, even though it is not a hurricane.
The cone represents the probable track of the center of a tropical cyclone, and is formed by enclosing the area swept out by a set of
circles (not shown) along the forecast track (at 12, 24, 36 hours, etc.). The size of each circle is set so that two-thirds of historical
official forecast errors over a 5-year sample fall within the circle. The circle radii defining the cones in 2023 for the Atlantic and
eastern North Pacific basins are given in the table below. Radii of NHC forecast cone circles for 2023, based on error statistics from 2018–2022:
| Forecast Period (hours) | Atlantic (2/3) Probability Circle (nautical miles) | Eastern and Central Pacific (2/3) Probability Circle (nautical miles) |
| 12 | 26 | 25 |
| 24 | 39 | 38 |
| 36 | 53 | 51 |
| 48 | 67 | 63 |
| 60 | 81 | 78 |
| 72 | 99 | 86 |
| 96 | 145 | 110 |
| 120 | 205 | 137 |
Graphics for Atlantic tropical cyclones are normally issued every six hours at 5:00 AM EDT, 11:00 AM EDT, 5:00 PM EDT, and 11:00 PM EDT (or 4:00 AM EST, 10:00 AM EST, 4:00 PM EST, and 10:00 PM EST).
Graphics for Eastern Pacific tropical cyclones are normally issued every six hours at 2:00 AM PDT, 8:00 AM PDT, 2:00 PM PDT, and 8:00 PM PDT (or 1:00 AM PST, 7:00 AM PST, 1:00 PM PST, and 7:00 PM PST).
Graphics for Central Pacific tropical cyclones are normally issued every six hours at 5:00 AM HST, 11:00 AM HST, 5:00 PM HST, and 11:00 PM HST.
The graphics also will be updated when intermediate public advisories are issued, and special graphics may be issued at any time due to significant changes in warnings or in the cyclone.
Note: A detailed definition of the NHC track forecast cone is also available.
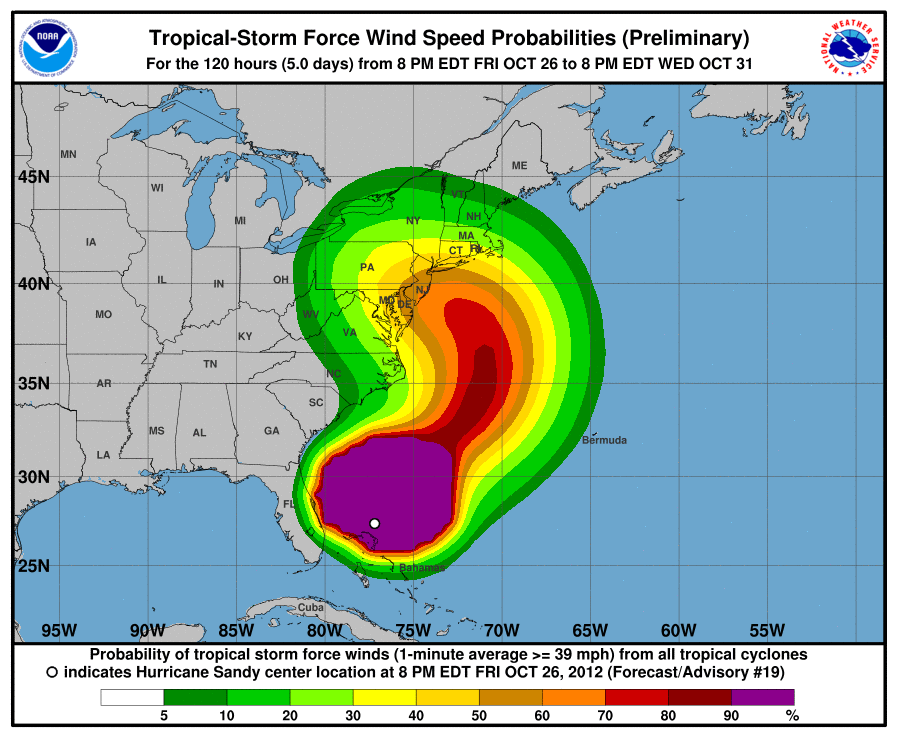
This graphic depicts the probability (likelihood, expressed as a percentage) that sustained (1-min average) winds meeting or
exceeding specific thresholds will occur at particular locations over particular intervals of time. These probabilities are
based on the track, intensity, and wind structure (size) forecasts from the National Hurricane Center and their historical
error characteristics. Separate graphics are provided for the 34 kt (tropical storm force), 50 kt, and 64 kt (hurricane force) wind thresholds.
The graphic provides location-specific cumulative occurrence probabilities – these values tell you the probability the wind event
will occur sometime during the specified cumulative forecast period (0-12, 0-24, 0-36 hours, etc., out to 0-120 h) at each specific
point. The images can be looped to show how the threat evolves over the five-day period of the forecast.
It is important for users to realize that probabilities that may seem relatively small (e.g., 5-10%) may still be quite significant.
Users are urged to consider the potentially large costs (in terms of lives, property, etc.) of not preparing for an extreme event.
Graphics for Atlantic tropical cyclones are normally issued every six hours at 5:00 AM EDT, 11:00 AM EDT, 5:00 PM EDT, and 11:00 PM EDT (or 4:00 AM EST, 10:00 AM EST, 4:00 PM EST, and 10:00 PM EST).
Graphics for Eastern Pacific tropical cyclones are normally issued every six hours at 2:00 AM PDT, 8:00 AM PDT, 2:00 PM PDT, and 8:00 PM PDT (or 1:00 AM PST, 7:00 AM PST, 1:00 PM PST, and 7:00 PM PST).
Graphics for Central Pacific tropical cyclones are normally issued every six hours at 5:00 AM HST, 11:00 AM HST, 5:00 PM HST, and 11:00 PM HST.
Special graphics may be issued at any time due to significant changes in warnings or in the cyclone.
Note: A more detailed description of these probability products is also available.
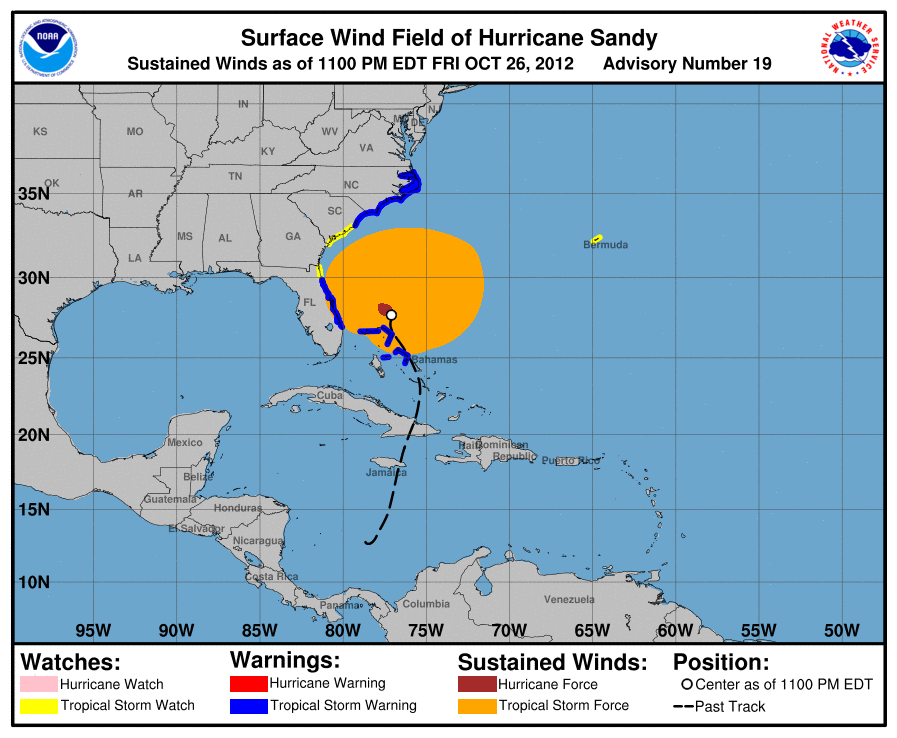
This graphic shows the areas potentially being affected by the sustained winds of tropical storm force (in orange) and hurricane force (in red). The display is based on the wind radii contained in the latest Forecast/Advisory (indicated at the top of the figure). Users are reminded that the Forecast/Advisory wind radii represent the maximum possible extent of a given wind speed within particular quadrants around the tropical cyclone. As a result, not all locations falling within the orange or red shaded areas will be experiencing sustained tropical storm or hurricane force winds, respectively.
In addition to the wind field, this graphic shows an approximate representation of coastal areas under a hurricane warning (red), hurricane watch (pink), tropical storm warning (blue) and tropical storm watch (yellow). The white dot indicates the current position of the center of the tropical cyclone, and the dashed line shows the history of the center of the tropical cyclone.
Graphics for Atlantic tropical cyclones are normally issued every six hours at 5:00 AM EDT, 11:00 AM EDT, 5:00 PM EDT, and 11:00 PM EDT (or 4:00 AM EST, 10:00 AM EST, 4:00 PM EST, and 10:00 PM EST).
Graphics for Eastern Pacific tropical cyclones are normally issued every six hours at 2:00 AM PDT, 8:00 AM PDT, 2:00 PM PDT, and 8:00 PM PDT (or 1:00 AM PST, 7:00 AM PST, 1:00 PM PST, and 7:00 PM PST).
Graphics for Central Pacific tropical cyclones are normally issued every six hours at 5:00 AM HST, 11:00 AM HST, 5:00 PM HST, and 11:00 PM HST.
Special graphics may be issued at any time due to significant changes in warnings or in the cyclone.
Note: Please read the Tropical Cyclone Surface Wind Field full product description.
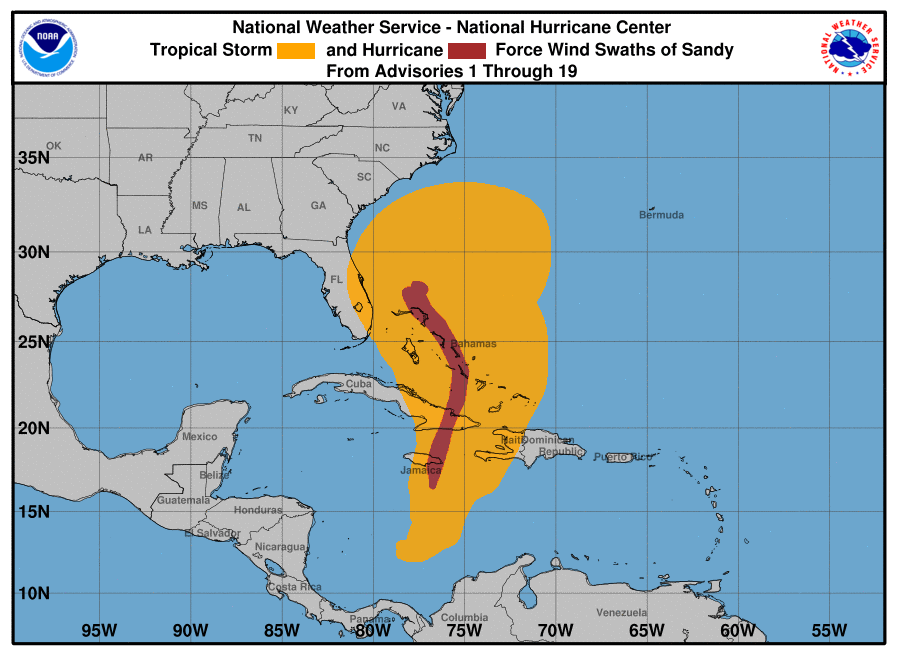
This graphic shows how the size of the storm has changed, and the areas potentially affected so far by sustained winds of tropical storm force (in orange) and hurricane force (in red). The display is based on the wind radii contained in the set of Forecast/Advisories indicated at the top of the figure. Users are reminded that the Forecast/Advisory wind radii represent the maximum possible extent of a given wind speed within particular quadrants around the tropical cyclone. As a result, not all locations falling within the orange or red swaths will have experienced sustained tropical storm or hurricane force winds, respectively.
Graphics for Atlantic tropical cyclones are normally issued every six hours at 5:00 AM EDT, 11:00 AM EDT, 5:00 PM EDT, and 11:00 PM EDT (or 4:00 AM EST, 10:00 AM EST, 4:00 PM EST, and 10:00 PM EST).
Graphics for Eastern Pacific tropical cyclones are normally issued every six hours at 2:00 AM PDT, 8:00 AM PDT, 2:00 PM PDT, and 8:00 PM PDT (or 1:00 AM PST, 7:00 AM PST, 1:00 PM PST, and 7:00 PM PST).
Graphics for Central Pacific tropical cyclones are normally issued every six hours at 5:00 AM HST, 11:00 AM HST, 5:00 PM HST, and 11:00 PM HST.
Special graphics may be issued at any time due to significant changes in warnings or in the cyclone.
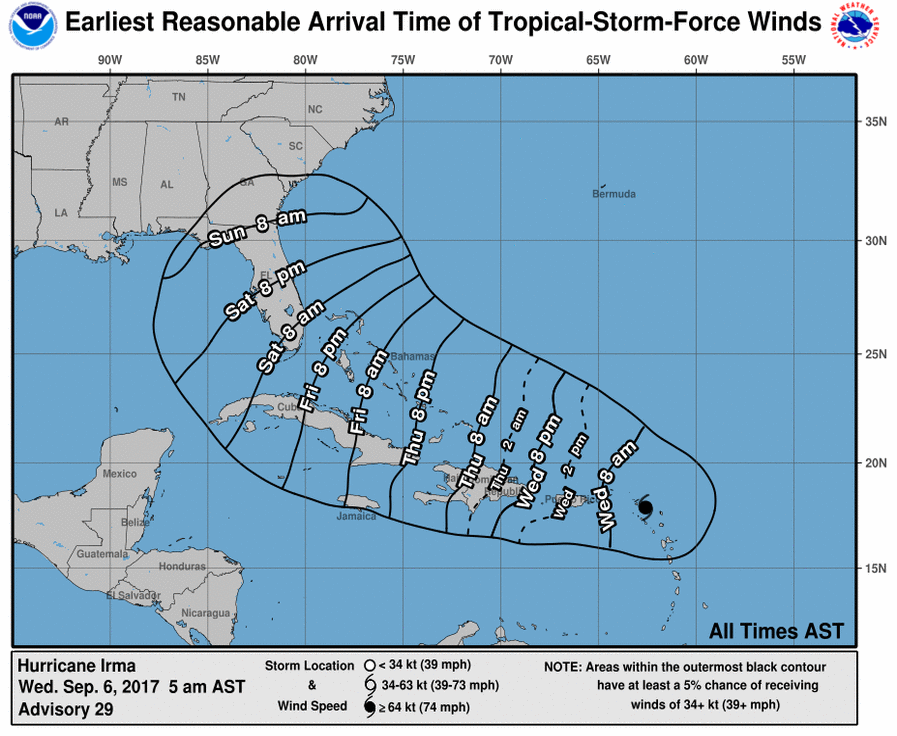
The anticipated arrival of sustained tropical-storm-force winds from a tropical cyclone is a critical threshold for coastal communities. For example, emergency managers use this information to determine when to begin and complete coastal evacuations, while the public needs to know when to prepare their homes or businesses and get supplies. Once sustained tropical-storm-force winds begin, such preparations usually become too dangerous or difficult. Historically, many decision makers have inferred the arrival of sustained tropical-storm-force winds from NHC products deterministically, without accounting for tropical cyclone track or size uncertainty. The risk in not factoring in these uncertainties is that communities may have less time to prepare if a tropical cyclone speeds up or increases in size beyond NHC's initial forecasts.
To better meet users' needs, NHC provides a set of graphics that depict when sustained tropical-storm-force winds from an approaching tropical cyclone could arrive at individual locations. The maps were developed and tested using social science techniques, including one-on-one telephone interviews, focus groups, and surveys with emergency managers, broadcast meteorologists, and NWS meteorologists to gather opinions on the idea, content, and design of the products.
Two versions of the Arrival of Tropical-Storm-Force Winds Graphic are available on the NHC website for all tropical cyclones, post-tropical cyclones, and potential tropical cyclones for which NHC is issuing advisories:
Additionally, three-day versions of these graphics are also available. These versions provide time of arrival information through the first 72 hours of the forecast. The three-day graphics are intended to help aid in viewing the timing details through 72 h when the forecast track has an usually lengthy extent.
Graphics for Atlantic tropical cyclones are normally issued every six hours at 5:00 AM EDT, 11:00 AM EDT, 5:00 PM EDT, and 11:00 PM EDT (or 4:00 AM EST, 10:00 AM EST, 4:00 PM EST, and 10:00 PM EST).
Graphics for Eastern Pacific tropical cyclones are normally issued every six hours at 2:00 AM PDT, 8:00 AM PDT, 2:00 PM PDT, and 8:00 PM PDT (or 1:00 AM PST, 7:00 AM PST, 1:00 PM PST, and 7:00 PM PST).
Graphics for Central Pacific tropical cyclones are normally issued every six hours at 5:00 AM HST, 11:00 AM HST, 5:00 PM HST, and 11:00 PM HST.
Special graphics may be issued at any time due to significant changes in warnings or in the cyclone.
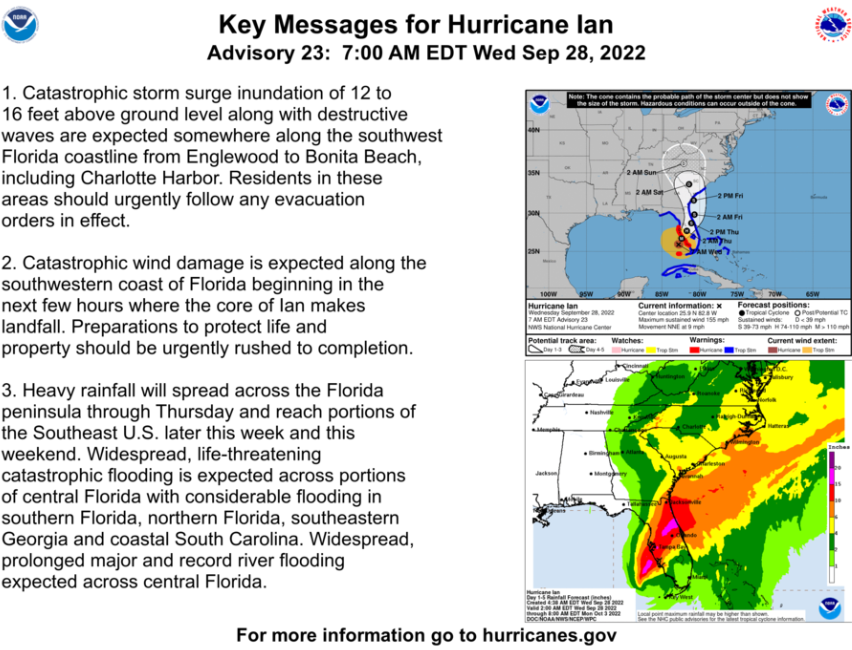
Key Messages, when available, are found in the Tropical Cyclone Discussion text product. They are designed
to highlight essential points about hazards and forecast uncertainty for select tropical cyclones. The Key
Messages graphic on the NHC website and NHC social media (Twitter and/or Facebook) pages includes the text
of the Key Messages and relevant tropical cyclone graphics, which can include the cone graphic, the 34-kt
cumulative wind speed probability graphic, arrival of tropical-storm-force winds graphic, peak storm surge
graphic, or a rainfall forecast graphic provided by the Weather Prediction Center.
The National Hurricane Center encourages sharing and use of the Key Messages graphics. The Key Messages graphics,
like all information on National Weather Service web pages are in the public domain and may be used or shared for
any lawful purpose so long as you do not: 1) claim it is your own (e.g., by claiming copyright for NWS information),
2) use it in a manner that implies an endorsement or affiliation with NOAA/NWS, or 3) modify its content and then
present it as official government material. You also cannot present information of your own in a way that makes it
appear to be official government information. For more information, go to www.weather.gov/disclaimer
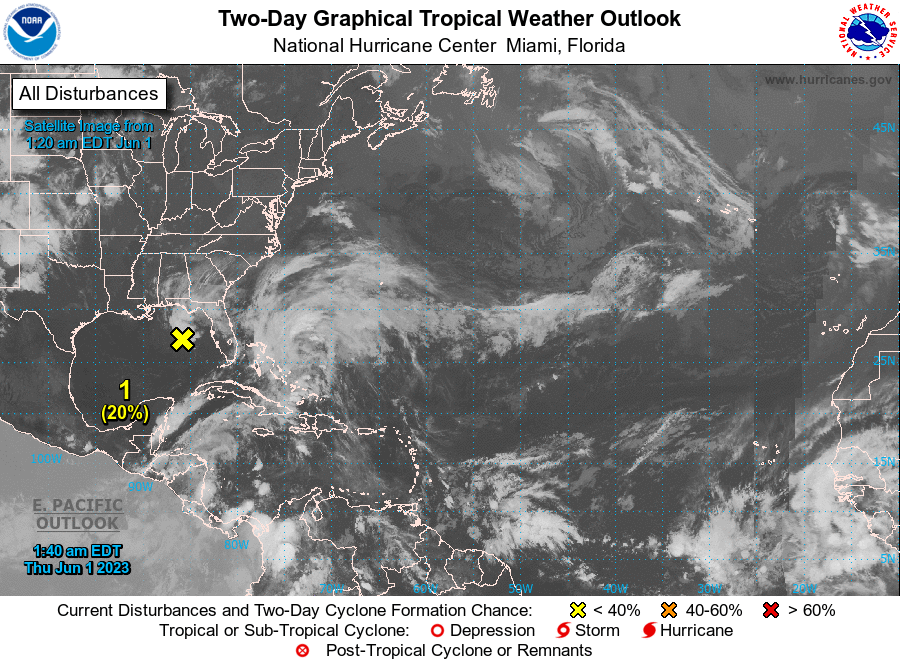
The 2-Day Graphical Tropical Weather Outlook (TWO) depicts significant areas of disturbed weather and their potential for development during the next 48 hours. The 2-Day Graphical TWO also shows the locations of any active tropical cyclones. The location of areas of disturbed weather on the graphic are denoted by an X and numbered, with text discussions for each disturbance given beneath the graphic.
The potential for tropical cyclone formation for each disturbance within the next 48 hours will be indicated by the color of the X; yellow indicates a low probability of development (0-30%), orange indicates medium likelihood (40-60%), and red indicates a high likelihood of development (70-100%).
The graphic is interactive; users can mouse over cyclones or disturbances in the graphic and pop-up windows will appear with cyclone advisory information or the text Outlook discussion for that disturbance. Clicking on a tropical cyclone symbol will take the user to a new web location that contains all advisories and products for the cyclone. Clicking on a disturbance will take you to a zoomed satellite image of that disturbance. Information on the motion and potential impacts of each disturbance is available in the text descriptions but is not displayed graphically.
The Tropical Weather Outlook is issued every six hours from 15 May–30 November for the Atlantic and Eastern North Pacific Basins, and from 1 June–30 November for the Central Pacific Basins at 0000, 0600, 1200, 1800 UTC. Local issuance times are shown in the table below.
| Basin | Local Issuance Times During Daylight Savings Time | Local Issuance Times During Standard Time |
| Atlantic (15 May–30 November) |
2:00 am EDT 8:00 am EDT 2:00 pm EDT 8:00 pm EDT |
1:00 am EST 7:00 am EST 1:00 pm EST 7:00 pm EST |
| Eastern North Pacific (15 May–30 November) |
5:00 am PDT 11:00 am PDT 5:00 pm PDT 11:00 pm PDT |
4:00 am PST 10:00 am PST 4:00 pm PST 10:00 pm PST |
| Central North Pacific (1 June–30 November) |
2:00 am HST 8:00 am HST 2:00 pm HST 8:00 pm HST |
The 2-Day Graphical TWO is usually available shortly after the text TWO has been issued, but occasionally there might be a slight delay for the updated graphic to appear on the NHC website. For this reason, users are reminded that the text TWO may show updated information a few minutes prior to the 2-Day Graphical TWO.
A special TWO may be issued at any time when important changes in areas of disturbed weather over tropical or subtropical waters need to be conveyed before the next scheduled release of the TWO.
Note: A more complete description of the Graphical Tropical Weather Outlook can be found here.
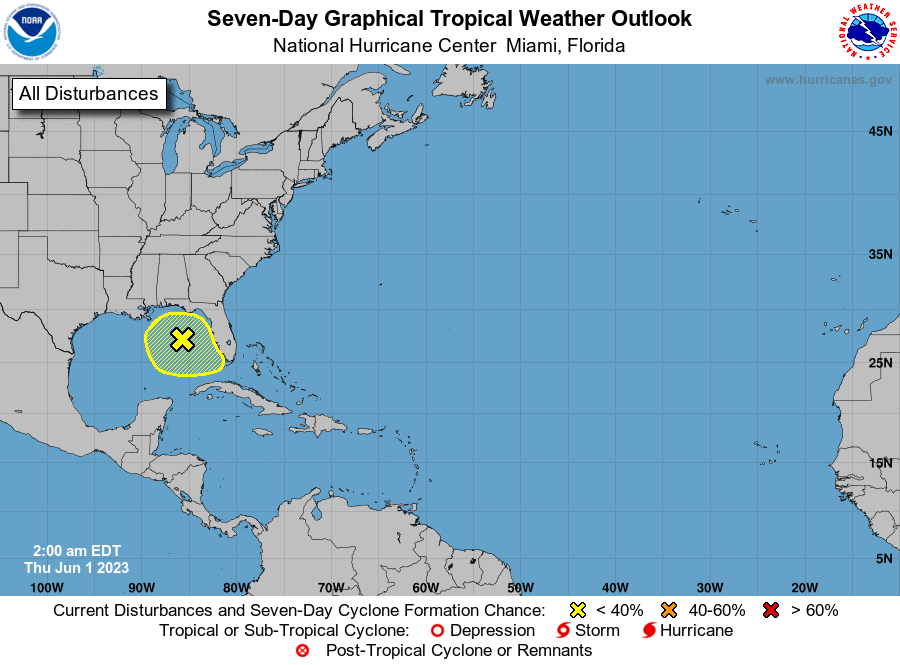
The 7-day Graphical Tropical Weather Outlook (TWO) became operational in 2023. This graphic provides formation potential for individual disturbances during the next 7-day period. The areas enclosed on the graph represent the potential formation area during the forecast period.
The areas are color coded based on the potential for tropical cyclone formation during the next 7-days. Yellow indicates a low probability of development (0-30%), orange indicates medium likelihood (40-60%), and red indicates a high likelihood of development (70-100%).
The location of existing disturbances is indicated by an X. If the formation potential of an existing disturbance does not include the area in which the disturbance is currently located, an arrow will connect the current location of the disturbance to its area of potential formation. Areas without an X or not connected by an arrow to an X indicate that the disturbance does not currently exist, but is expected to develop during the 7-day period.
The graphic is interactive; users can mouse over disturbances in the graphic and pop-up windows will appear with cyclone advisory information or the text Outlook discussion for that disturbance. Clicking on a disturbance will take the user to a graphic that shows only that disturbance.
The Tropical Weather Outlook is issued every six hours from 15 May–30 November for the Atlantic and Eastern Pacific Basins, and from 1 June–30 November for the Central North Pacific Basin at 0000, 0600, 1200, 1800 UTC. Local issuance times are shown in the table below.
| Basin | Local Issuance Times During Daylight Savings Time | Local Issuance Times During Standard Time |
| Atlantic (15 May–30 November) |
2:00 am EDT 8:00 am EDT 2:00 pm EDT 8:00 pm EDT |
1:00 am EST 7:00 am EST 1:00 pm EST 7:00 pm EST |
| Eastern North Pacific (15 May–30 November) |
5:00 am PDT 11:00 am PDT 5:00 pm PDT 11:00 pm PDT |
4:00 am PST 10:00 am PST 4:00 pm PST 10:00 pm PST |
| Central North Pacific (1 June–30 November) |
2:00 am HST 8:00 am HST 2:00 pm HST 8:00 pm HST |
The graphical TWO is usually available shortly after the text TWO has been issued, but occasionally there might be a slight delay for the updated graphic to appear on the NHC website. For this reason, users are reminded that the text TWO may show updated information a few minutes prior to the graphical TWO.
A special TWO may be issued at any time when important changes in areas of disturbed weather over tropical or subtropical waters need to be conveyed before the next scheduled release of the TWO.
Note: A more complete description of the Graphical Tropical Weather Outlook can be found here.
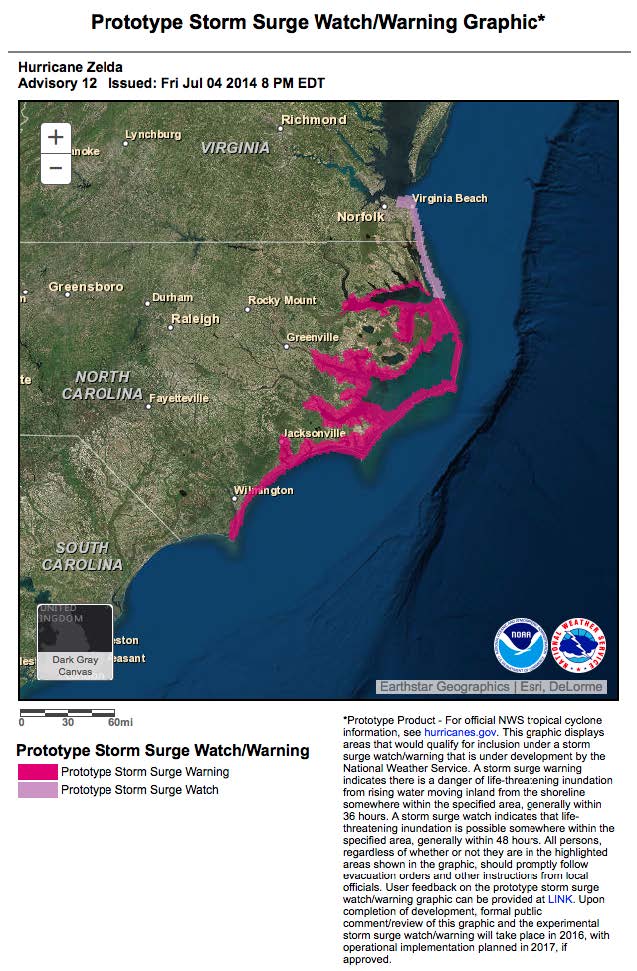 Example Static example of the Storm Surge Watch and Warning Graphic. Note that the actual product is interactive with pan and zoom capability.
Storm surge is rising water moving inland from the shoreline, pushed by the force of the wind. The Storm Surge Watch and Warning Graphic displays areas under a storm surge watch or
warning. A storm surge warning means that there is a danger of life-threatening inundation from rising water moving inland from the shoreline somewhere within the specified area,
generally within 36 hours. A storm surge watch means that life-threatening inundation is possible somewhere within the specified area, generally within 48 hours. The graphic is
intended to help users visualize areas most at risk from life-threatening surge, and serve as a call to action. All persons, regardless of whether or not they are in the highlighted
areas shown by the graphic, should promptly follow evacuation orders and other instructions from local emergency management officials. The graphic is the results of a collaborative
process between the National Hurricane Center and local Weather Forecast Offices.
This graphic is part of a suite of products issued for active tropical cyclones every six hours at 0300, 0900, 1500, and 2100 UTC whenever storm surge watches or warnings are in
effect along any portion of the United States Gulf or Atlantic coasts, Puerto Rico, or the U.S. Virgin Islands. The graphic can be updated with any changes in the intermediate
advisory package or with a special advisory. When active, the Storm Surge Watch and Warning Graphic will be available on the NHC website in a web map viewer.
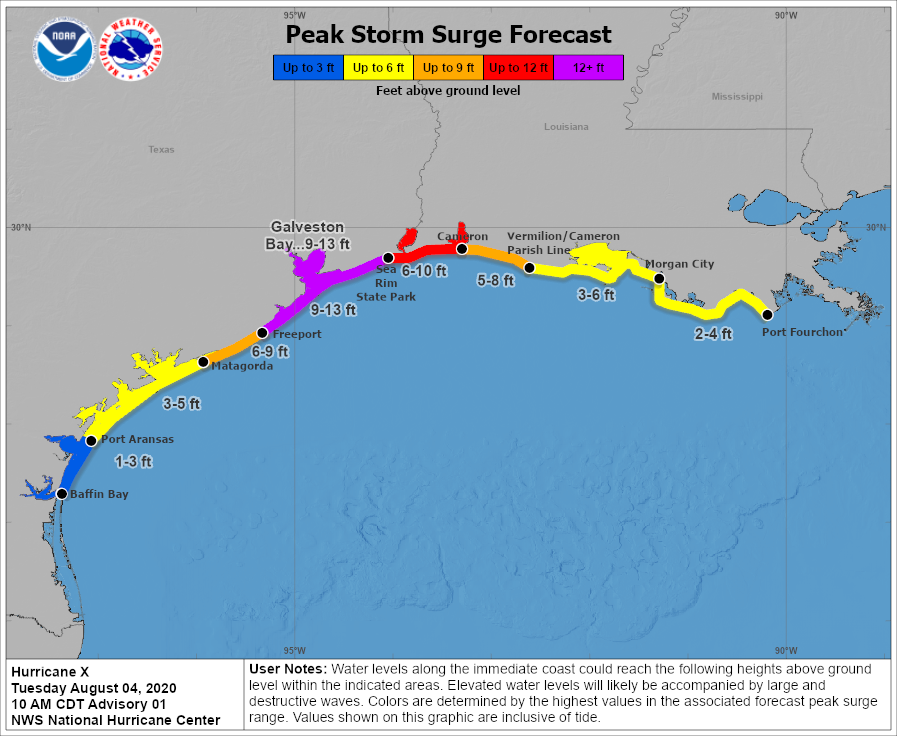 Example Static example of the Peak Storm Surge Forecast Graphic.
The Peak Storm Surge Forecast Graphic shows the expected inundation along the immediate coast from storm surge and tides that are provided in the tropical cyclone public advisory
(TCP). These values represent the height that water could reach above normally dry ground somewhere within the specified areas. A range of values is given to express forecast
uncertainty and to account for varying coastal geography. Colors are based on the highest value in the associated forecast range, thus different forecast ranges can appear as
the same color (e.g. 3-5 ft, 3-6 ft, and 2-4 ft all appear as yellow in the example graphic because the highest value in the range is ‘Up to 6ft’). The graphic is subject to
change every three hours in association with a new NHC full or intermediate advisory package.
This graphic is part of a suite of products issued for active cyclones every six hours at 0300, 0900, 1500, and 2100 UTC, whenever a storm surge watch or warning is in effect
for any portion of the United States Gulf or Atlantic coasts, Puerto Rico, or the U.S. Virgin Islands. The graphic can be issued at other times as appropriate, including for
hurricane or tropical storm wind watches or warnings. The graphic can be updated with changes in the intermediate advisory or with a special advisory. When active, the Peak
Storm Surge Forecast Graphic will be available on the NHC website and for KML data download.
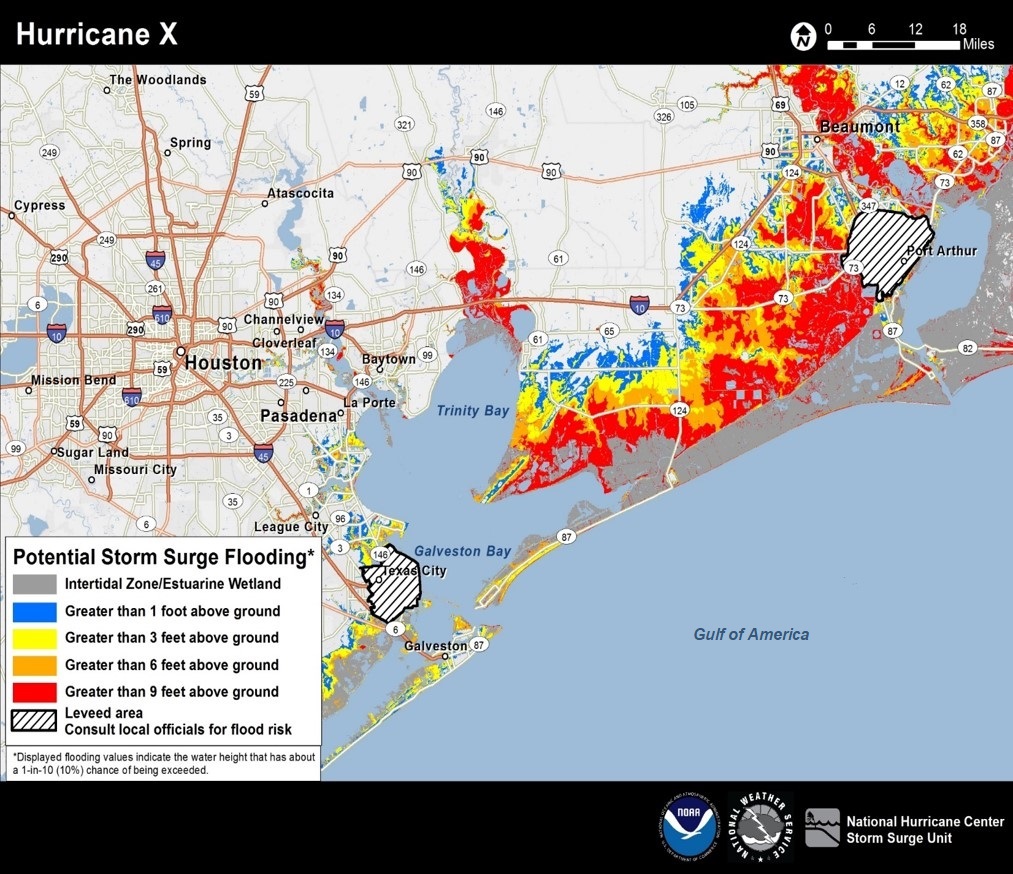
Example Static example of the Potential Storm Surge Flooding Map. Note that the actual product is interactive with pan and zoom capability.
The Potential Storm Surge Flooding Map shows geographical areas where inundation from storm surge could occur and how high above ground the water could reach in those areas. The
map is based on the Probabilistic Tropical Cyclone Storm Surge and Tides (P-Surge) model that uses the latest NHC official forecast and historical forecast errors to create an
ensemble of simulations that accounts for uncertainty related to the storm’s landfall location and forward speed, intensity, and size. The shading on Potential Storm Surge
Flooding Map represents inundation levels that have a 10 percent chance of being exceeded, which can therefore be thought of as representing a reasonable worst-case scenario for
any individual location. The map is subject to change every six hours in association with a new NHC full advisory package.
This graphic is part of a suite of products issued for active tropical cyclones every six hours at 0300, 0900, 1500, and 2100 UTC, whenever a storm surge watch or warning is in
effect for any portion of the United States Gulf or Atlantic coasts, Puerto Rico, or the U.S. Virgin Islands. The graphic can be issued at other times as appropriate, including
for hurricane or tropical storm wind watches or warnings. The first map will usually be issued along with the first issuance of the storm surge watch, approximately 48 hours prior
to hazardous weather conditions, but, in some cases, it can be issued as early as 72 hours in advance when confidence in the forecast and storm surge guidance is high. When active,
the Potential Storm Surge Flooding Map will be available on the NHC website in a web map viewer, for GeoTIFF data download for viewing in local GIS, and as a map service on NOAA
nowCOAST OGC Map Services (WMS). Due to the processing time required to produce the map, there will generally be a delay of an hour or more in the posting of this graphic to the
NHC website, or soon after the availability of the P-Surge products.
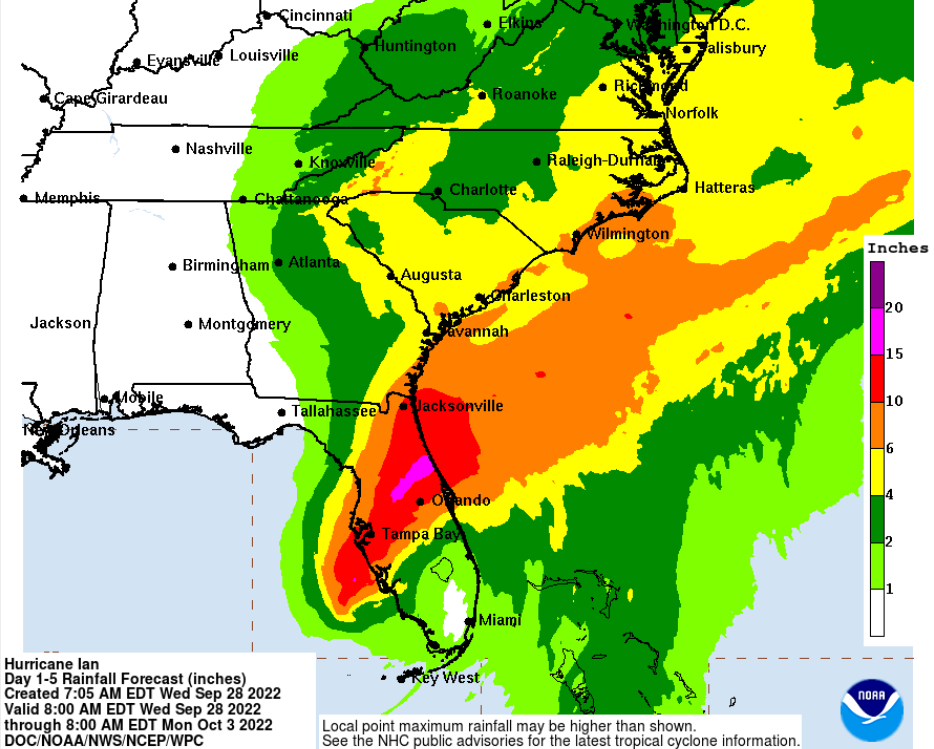
This graphic is created by the NWS/NCEP Weather Prediction Center (WPC) and shows rainfall potential for the United States when a tropical cyclone threatens land. The graphic is displayed as a Quantitative Precipitation Forecast (QPF), which shows rainfall totals for a specified time period, based on forecaster discretion. For more rainfall information, visit WPC Quantitative Precipitation Forecasts.
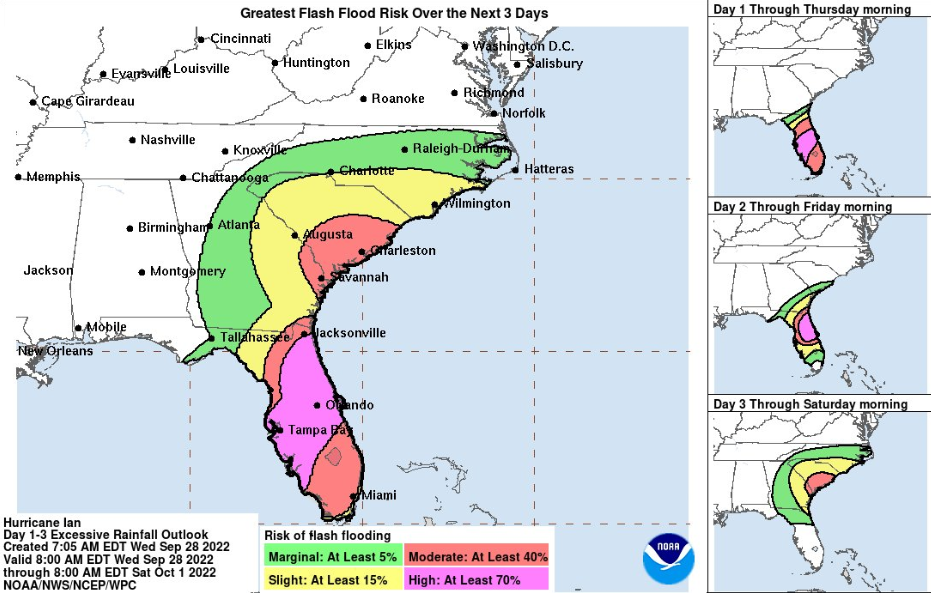
This set of graphics, called the Excessive Rainfall Outlook, is created by the NWS/NCEP Weather Prediction Center (WPC) and shows the risk of flash flooding due to heavy rainfall from a tropical cyclone affecting the United States. The Excessive Rainfall Outlook is based on the probability that rainfall will exceed flash flood guidance within 40 kilometers (25 miles) of a point, and it is a collaborated product between meteorologists and hydrologists from WPC, the Weather Forecast Offices (WFOs), River Forecast Centers (RFCs), and the National Water Center. For more information, visit WPC Excessive Rainfall Outlooks (EROs).
Alternate Formats
About Alternates -
E-Mail Advisories -
RSS Feeds
Cyclone Forecasts
Latest Advisory -
Past Advisories -
About Advisories
Marine Forecasts
Latest Products -
About Marine Products
Tools & Data
Satellite Imagery -
US Weather Radar -
Aircraft Recon -
Local Data Archive -
Forecast Verification -
Deadliest/Costliest/Most Intense
Learn About Hurricanes
Storm Names
Wind Scale -
Prepare -
Climatology -
NHC Glossary -
NHC Acronyms -
Frequently Asked Questions -
AOML Hurricane-Research Division
About Us
About NHC -
Mission/Vision -
Other NCEP Centers -
NHC Staff -
Visitor Information -
NHC Library
NOAA/
National Weather Service
National Centers for Environmental Prediction
National Hurricane Center
11691 SW 17th Street
Miami, Florida, 33165-2149 USA
nhcwebmaster@noaa.gov
Disclaimer
Privacy Policy
Credits
About Us
Glossary
Career Opportunities
Page last modified: Thursday, 24-Aug-2023 13:17:23 UTC